FTIR Analysis of Coral Skeletons
research 21 Sep 2022Overview
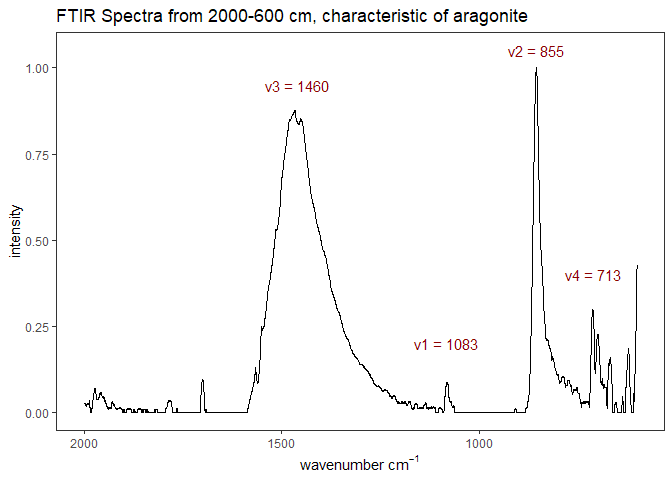
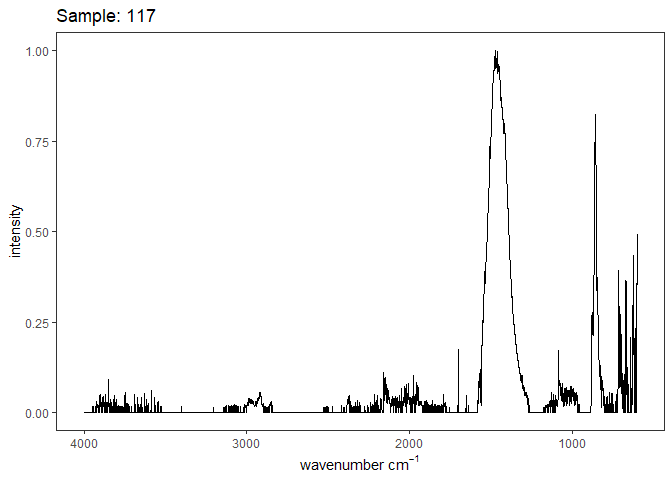
Fourier-transform infrared spectroscopy (FTIR) is a semi-quantitative technique that measures how much light a sample transmits (or absorbs) at each wavelength. Each covalent bond will absorb/transmit infrared light reflective of its stretching or bending mode. We can then use known regions (based on the molecular bonding of a substance) to characterize samples. For aragonite, there are four identifiable modes:
- v3 ~ 1460 and corresponds to the antistretching of the carbonate ion
- v1 ~ 1083 and corresponds to the symmetric stretching vibration of the carbonate ion
- v2 ~ 855 and corresponds to the bending vibrations of carbonate out of plane
- v4 ~ 713 and corresponds to the bending vibrations of carbonate in plane, see double peak around 699
Aragonite differs slightly from calcite (polymorph of calcium carbonate), which has a v2 ~ 874.
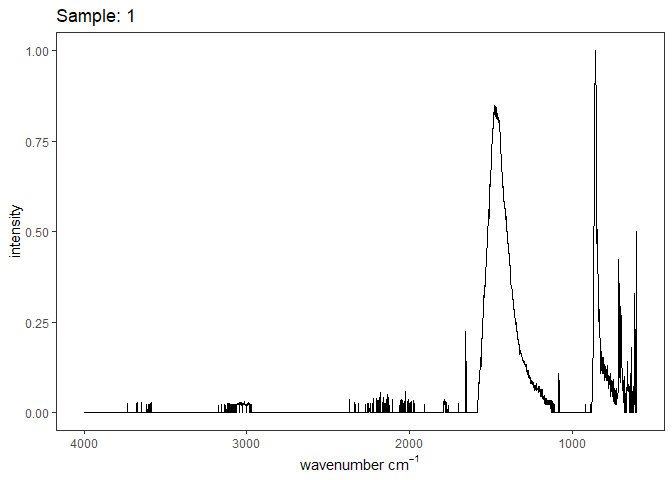
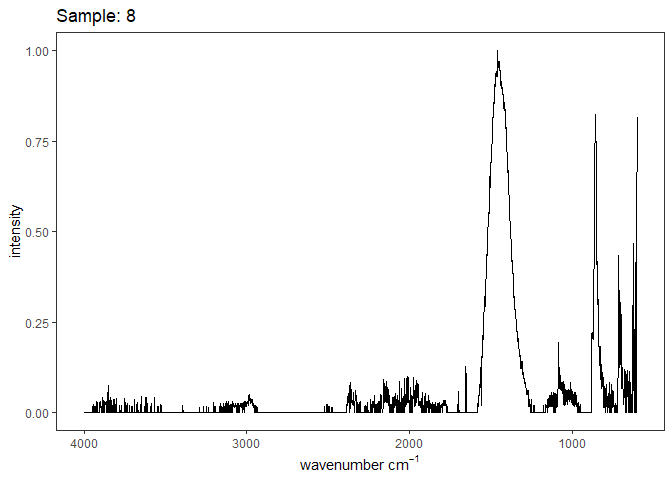
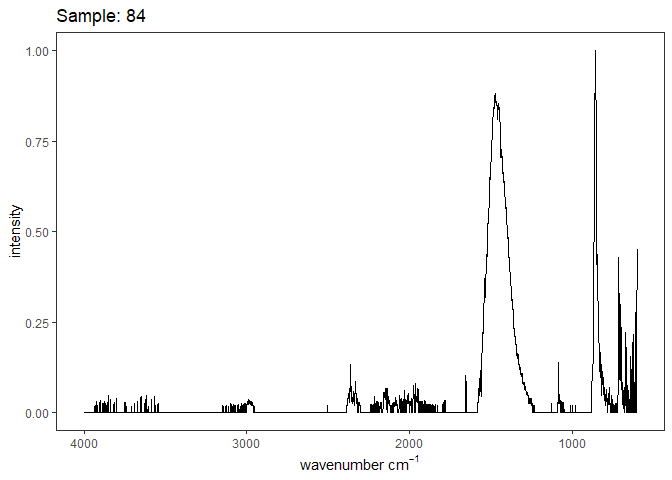
Spectra were captured in the UM Dept of Chemistry using their FTIR with an ATR accessory. Spectra were smoothed with a Savitzky-Golay filter fit with a 3rd order polynomial over 15 cm-1 and subsequently baseline corrected using the OpenSpecy open source spectral package in R. All data fit the characteristic vibrations peaks of aragonite outlined above.
If there are consistent impurities of the aragonite, we may be able to notice a shift in peak position and/or width. Further, we can construct ratios of regions to understand relative concentrations of different phases of organics or different regions of bond vibrations.
Currently, I have analyzed the standard peak position, peak intensity, and FWHM peak for the v1-v4 peaks outlined above. I am currently investigating other regions of interest related to intracrystaline organics and ratios we can construct to understand if there are any genotype-specific differences in the aragonite we can identify.
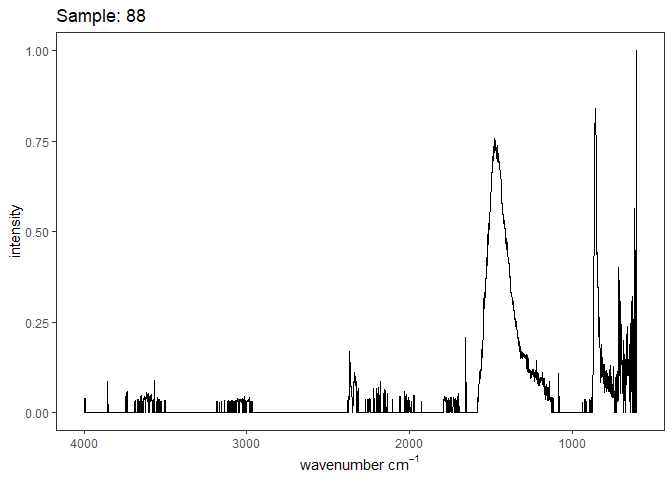
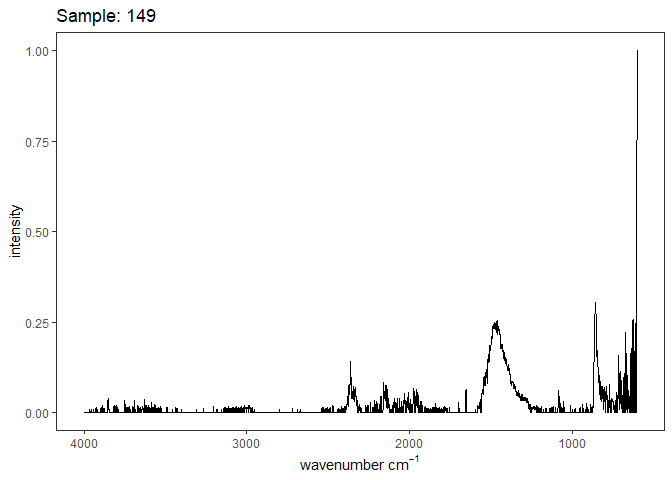
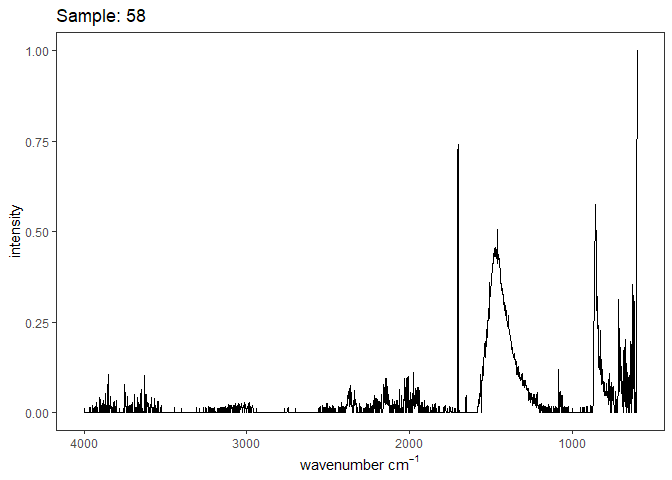
Figure 1. Example FTIR Spectrum
In this document, I review a few FTIR literature, describe the samples I have tested thus far and the proposed analysis methodology, and begin to analyze my initial results. This work complements the TGA data and has been performed on the same coral skeletons.
Literature Review
There are a handful of publications which have used FTIR to analyze coral skeletons and other aragonitic organisms. I have selected a subset of papers which have informed my analysis decisions, including Fitzer et al. 2019 and Falini et al. 2013 for their use of the method and the findings they present. A complete list of references I draw upon is included below.
Fitzer et al. 2019
This review chapter introduces the different tests that can be conducted to understand the effects of ocean acidification on the biomaterial. While the focus of much of the chapter is on non-coral calcifiers, the text provides a great introduction to the materials tests possible including FTIR.
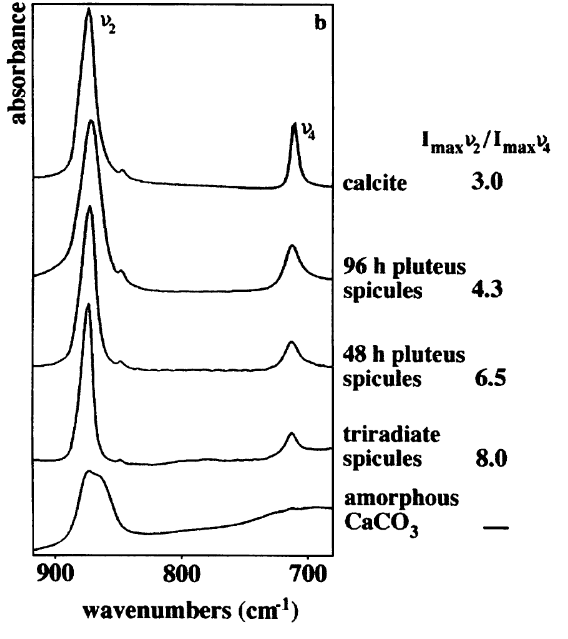
The chapter highlights the I2/I4 ratio to quantify the amount of amorphous calcium carbonate (ACC) present in the sample. The chapter cites Chan et al. 2012, who used this method to quantify ACC in a aragonite marine tube worm cultured under varius pH. The paper traces this analysis to Beniash et al. 1997 who quantified ACC in larval sea urchins and who better explained the ratio. ACC should not have a v4 band ~ 713, but should have a broad v2 band around 866 (recall 875 for calcite, 855 for aragonite). Thus, if a sample is a mixture of ACC and calcite, the ratios of I2/I4 should be higher than a sample of purely calcite. Beniash et al. 1997 documented this ratio as larvae matured and the ratio tended from approximately 8.0 at first stage to 4.3 approximately 96 hours later. Thus, this calcite precursor is only apparent very early in the stage of sea urchin larvae before the precursor becomes calcite. A ratio of approximately 3.0 implies the sample is entirely calcite.
Figure 2. I2/I4 ratios over time in larva sea urchin, Beniash et al. 1997
Chan et al. 2012 found that in marine worms cultured under high pCO2, the I2/I4 ratio increased (~4 @ pH=7.6, ~2.5 @ pH=8.1) and concluded that this is evidence for organisms to increase ACC during OA stress.
Since I am working with adult coral skeletons and the topic of ACC in corals is more contested than it is in other biogenic calcium carbonates, I do not expect to identify ACC. Nevertheless, I will proceed and quantify the I2/I4 ratio.
Falini et al. 2013
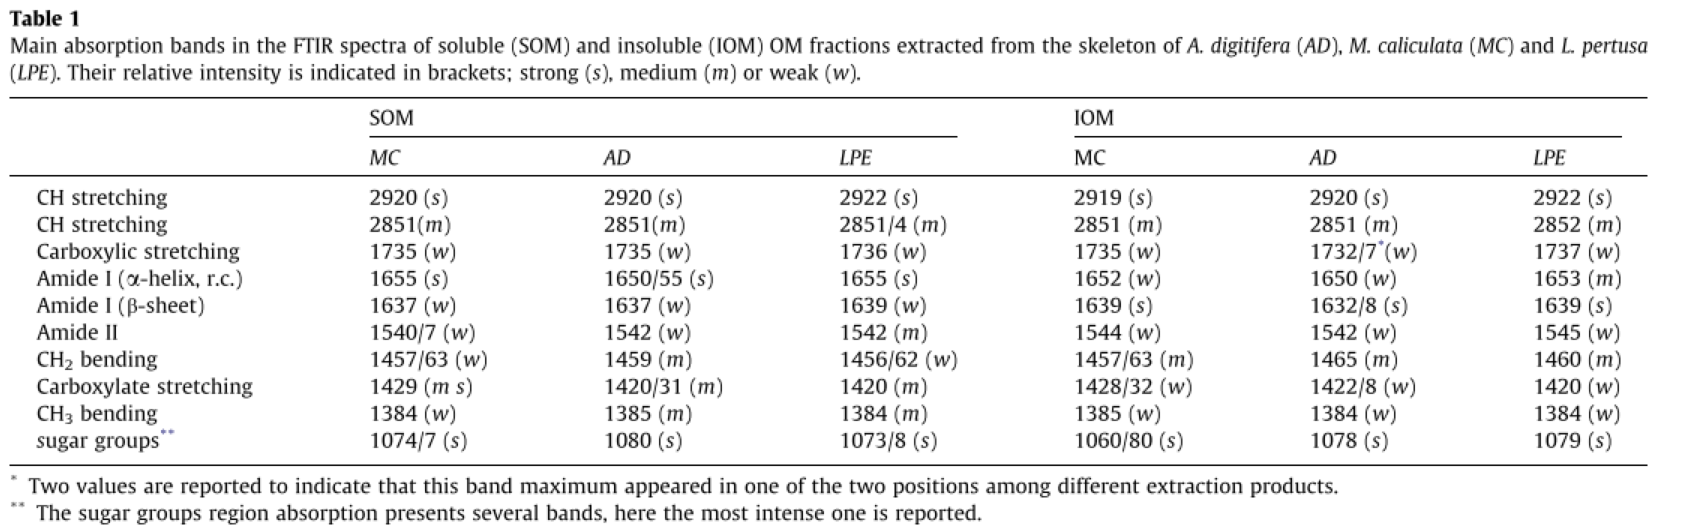
This paper investigated the organic molecules entrapped within the aragonite skeletons of corals. The authors extracted the organic matrix from the skeletons of Acropora digitifera, Lophelia pertusa, and Montipora caliculata with acetic acid and separated the extract into soluble and insoluble fractions. These fractions were analyzed separately with FTIR, polyacrylamide gel electrophoresis (SDS–PAGE) and amino-acidic analyses. Skeletons were additionally analyzed with a TGA to quantify bulk organics within the skeletons.
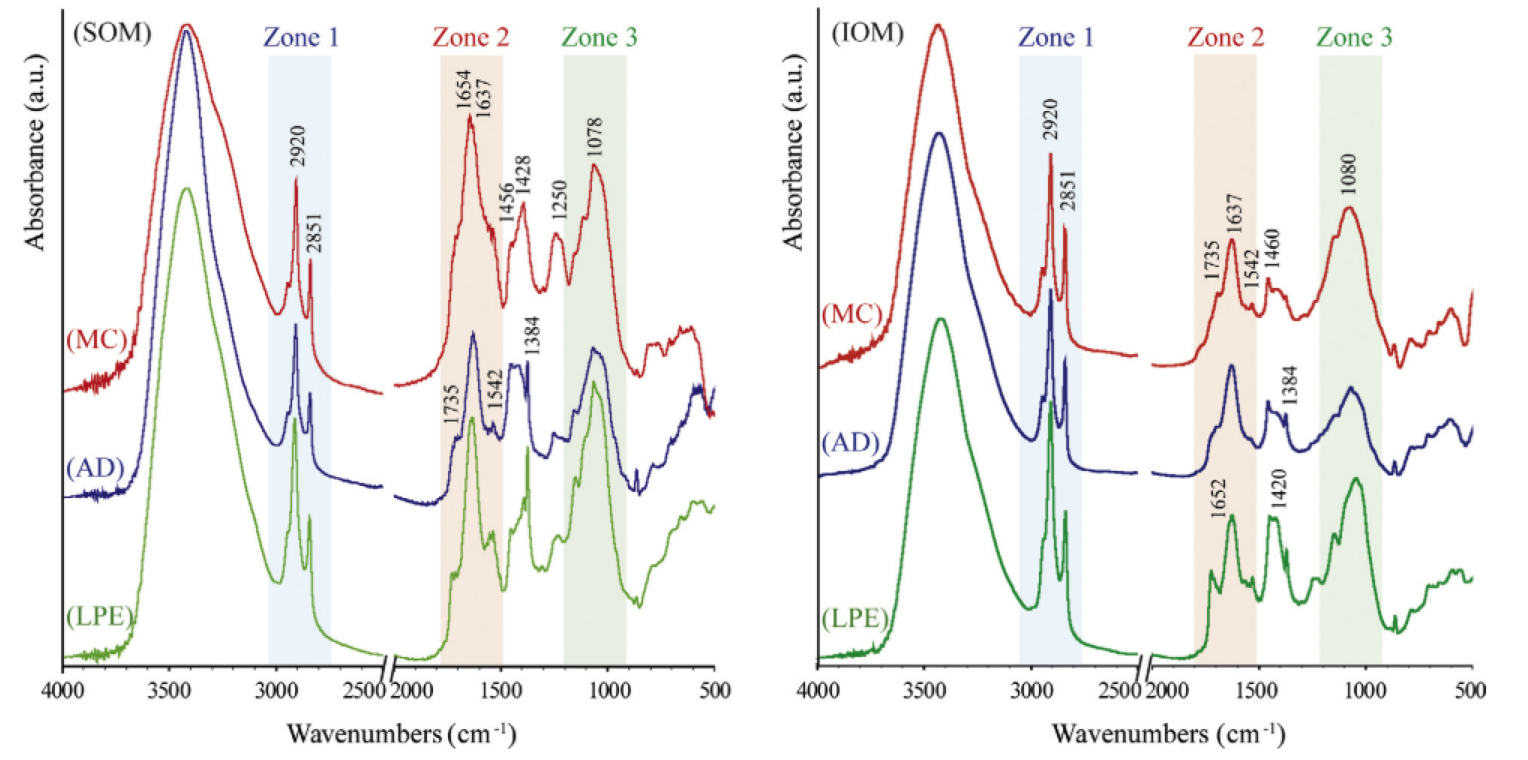
To estimate the relative amounts of the main functional groups of the organic matrix from the FTIR spectra, three zones were defined:
-
Zone 1 (3000–2800) - absorption due to the methylene and methyl groups’ vibration modes were present, they could mainly be related to the presence of fatty acids, mainly in IOM, or to molecules bearing alkylic chain regions.
-
Zone 2 (1750–1500) - absorption bands mainly associable to the amide I and II vibration modes of proteins (and of some sugars)
-
Zone 3 (1100–950) ether bonds and C–C single bond vibration modes, mainly associable to polysaccharides.
The authors integrated the intensities of the absorption zones 1 and 3 and normalized to that of zone 2 to compare relative abundances. The only identifiable difference from a Mann-Whitney test within organic fractions was the soluble organic fraction from L. pertusa which showed a significantly higher absorption in zone 3.
Figure 3. Falini 2013 FTIR Organic Matrix analysis regions
The soluble organic fraction from A. digitifera was rich in aspartate residues compared to the other species as determined by amino-acidic analyses. It has been shown in separate publications that aspartate sequences have an important role in the control of calcium carbonate precipitation (Elhadj et al., 2006; Stephenson et al., 2008). A. digitifera had the fastest calcification rates of the three species analyzed, further supporting the possible link of aspartate and calcification.
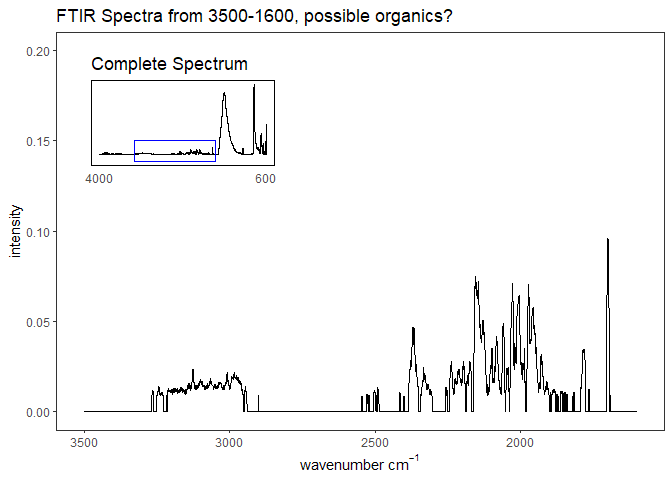
The organic regions identified here do not show strong peaks in our spectrums. The example below highlights how FTIR of powdered coral is different than that of the extracted morganic matrix shown in the Falini spectrum above. As such, I don’t think I can say much about these regions.
Figure 4. Coral powder example from 3500-1600, to analyze peaks identified in Falini et al. 2013
References
- Chan, V. B. S. et al. CO2-driven ocean acidification alters and weakens integrity of the calcareous tubes produced by the serpulid Tubeworm, Hydroides elegans. PLoS One 7, (2012).
- Cuif, J. P., Dauphin, Y. Y., Doucet, J., Salome, M. & Susini, J. XANES mapping of organic sulfate in three scleractinian coral skeletons. Geochim. Cosmochim. Acta 67, 75–83 (2003).
- Cuif, J. P. et al. Fine-scale growth patterns in coral skeletons: Biochemical control over crystallization of aragonite fibres and assessment of early diagenesis. Geol. Soc. Spec. Publ. 303, 87–96 (2008).
- Cuif, J. P., Dauphin, Y., Berthet, P. & Jegoudez, J. Associated water and organic compounds in coral skeletons: Quantitative thermogravimetry coupled to infrared absorption spectrometry. Geochemistry, Geophys. Geosystems 5, 1–9 (2004).
- Dauphin, Y., Cuif, J. P. & Massard, P. Persistent organic components in heated coral aragonitic skeletons-Implications for palaeoenvironmental reconstructions. Chem. Geol. 231, 26–37 (2006).
- Falini, G. et al. Control of aragonite deposition in colonial corals by intra-skeletal macromolecules. J. Struct. Biol. 183, 226–238 (2013).
- Fitzer, S. C. et al. Established and emerging techniques for characterising the formation, structure and performance of calcified structures under ocean acidification. Oceanography and Marine Biology: An Annual Review vol. 47 (2019).
- Goffredo, S. et al. Biomineralization control related to population density under ocean acidification. Nat. Clim. Chang. 4, 593–597 (2014).
- Goffredo, S. et al. The skeletal organic matrix from Mediterranean coral Balanophyllia Europaea influences calcium carbonate precipitation. PLoS One 6, (2011).
- Kaczorowska, B. et al. Spectroscopic characterization of natural corals. Anal. Bioanal. Chem. 377, 1032–1037 (2003).
- Leung, J. Y. S., Russell, B. D. & Connell, S. D. Mineralogical Plasticity Acts as a Compensatory Mechanism to the Impacts of Ocean Acidification. Environ. Sci. Technol. 51, 2652–2659 (2017).
- Rahman, M. A. & Halfar, J. First evidence of chitin in calcified coralline algae: New insights into the calcification process of Clathromorphum compactum. Sci. Rep. 4, (2014).
- Reggi, M. et al. Biomineralization in mediterranean corals: The role of the intraskeletal organic matrix. Cryst. Growth Des. 14, 4310–4320 (2014).
- Song, Y. et al. Vibrational spectroscopic characterization of growth bands in Porites coral from South China Sea. Spectrochim. Acta - Part A Mol. Biomol. Spectrosc. 112, 95–100 (2013).
Samples
The corals for this first batch of analysis come from Allyson Demerlis’s recent project where she investigated gene expression during a rapid bleaching experiment of 3 Acropora cervicornis genotypes. Some of the corals underwent a thermal stress-hardening treatment where the corals were exposed to a daily variable temperature which is believed to increase a coral’s bleaching resilience. The corals exposed to the high temperatures (36°C) had high amounts of mortality and I took these skeletons to analyze.
Figure 5. Calcification data from Allyson Demerlis’s project
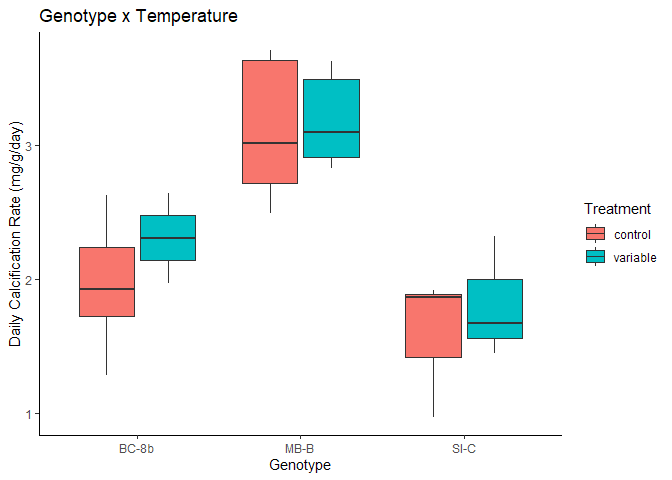
There was a significant effect of the coral genotype (F=23.27, p=7.78e-6), but no observed effect of stress hardening treatment on calcification rates (F=0.91, p=0.352). Following post-hoc testing, the significant genotype effect was driven by genotype MB-B which had much higher rates than BC-8B and SI-C which had similar calcification rates.
Thus, we are conducting these tests with a special focus on genotype MB-B to see if its faster calcification rate results in any observable differences in skeletal properties.
Proposed Analysis
To identify the peaks, I set a window (+/- 20cm) around the expected peak to identify relative maximum intensity. The maximum intensity and the wavenumber at the identified peak were extracted. For FWHM, the wave numbers around the peak which had intensity > .5*I were extrated, and the range of the extracted wavenumbers was identified as the FWHM.
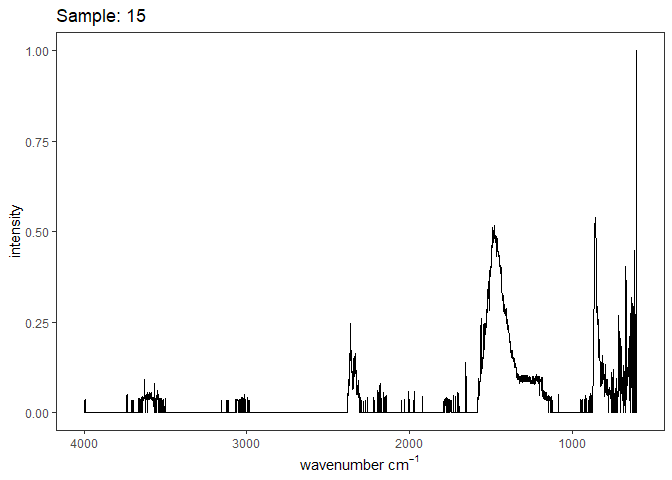
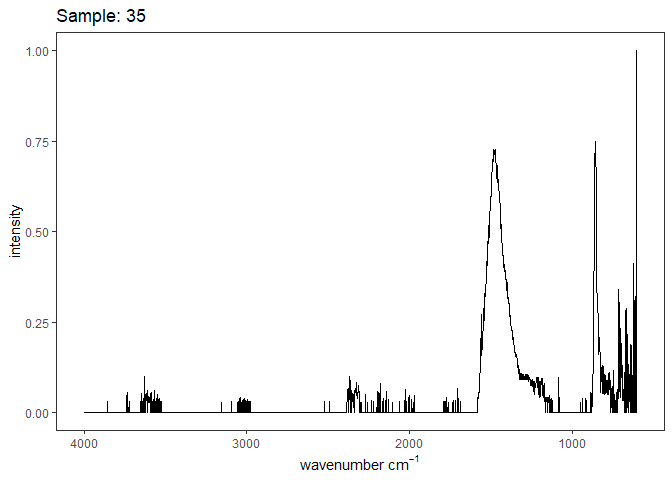
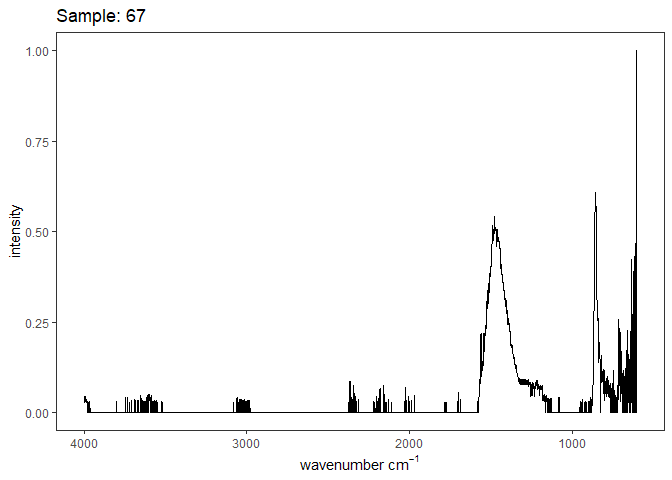
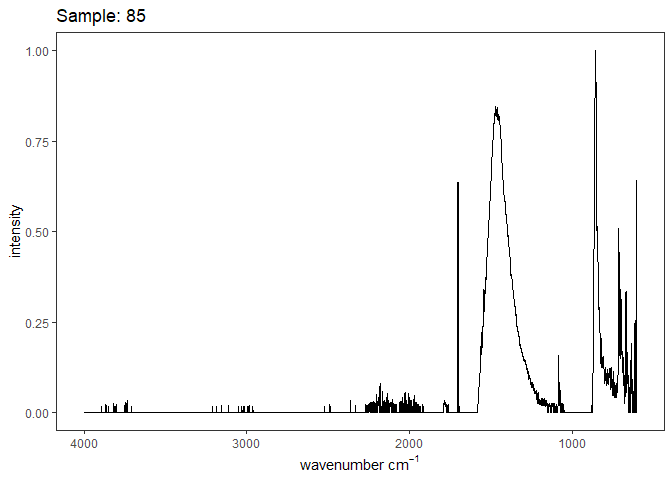
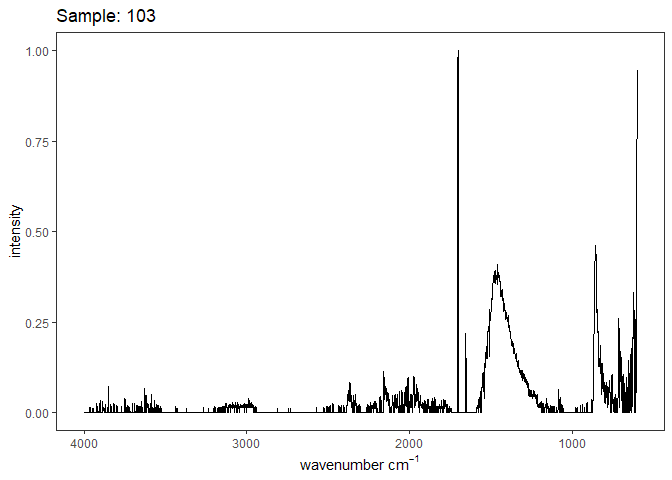
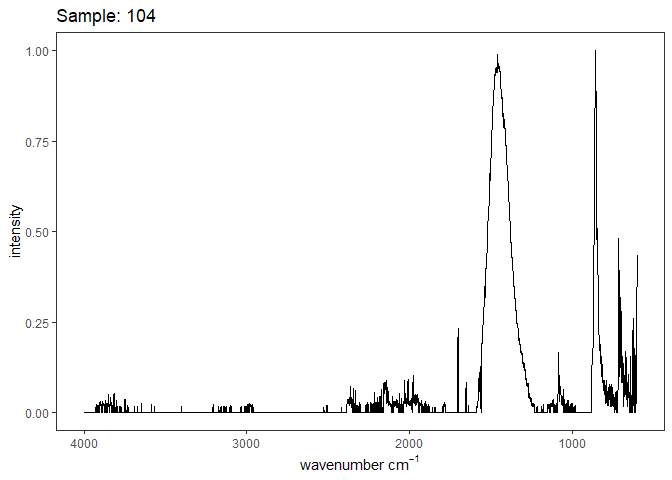
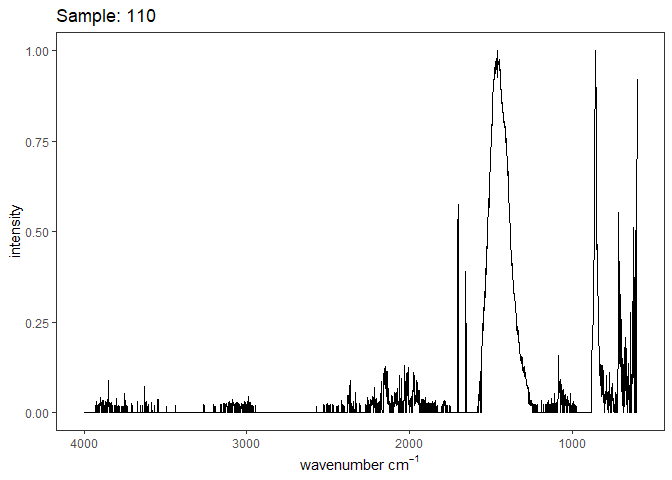
Results
[[1]]
 [[2]]
[[2]]
 [[3]]
[[3]]
 [[4]]
[[4]]
 [[5]]
[[5]]
 [[6]]
[[6]]
 [[7]]
[[7]]
 [[8]]
[[8]]
 [[9]]
[[9]]
 [[10]]
 [[11]]
 [[12]]
 [[13]]
 [[14]]
 [[15]]
 [[16]]
 [[17]]
 [[18]]
 [[19]]
 [[20]]
 [[21]]
 [[22]]
 [[23]]
 [[24]]
 [[25]]
 [[26]]
 [[27]]
 [[28]]
 [[29]]
 [[30]]
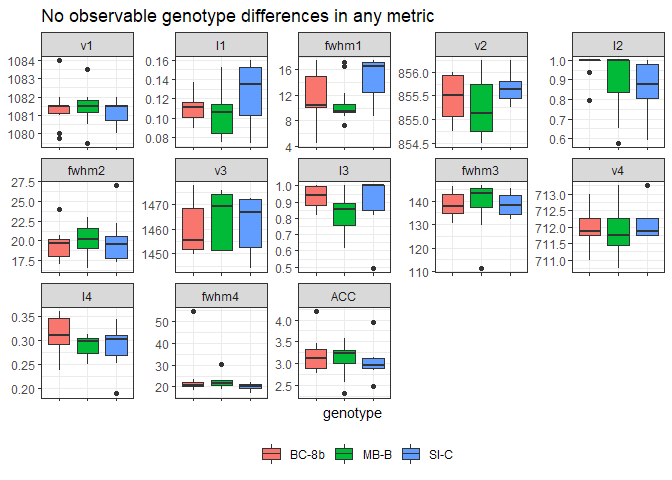
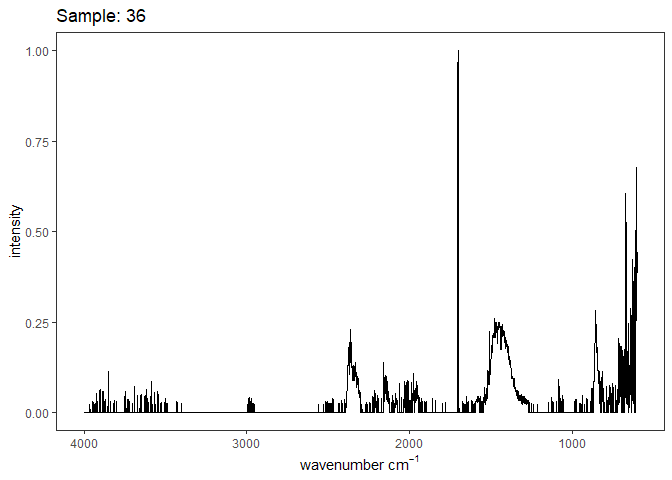
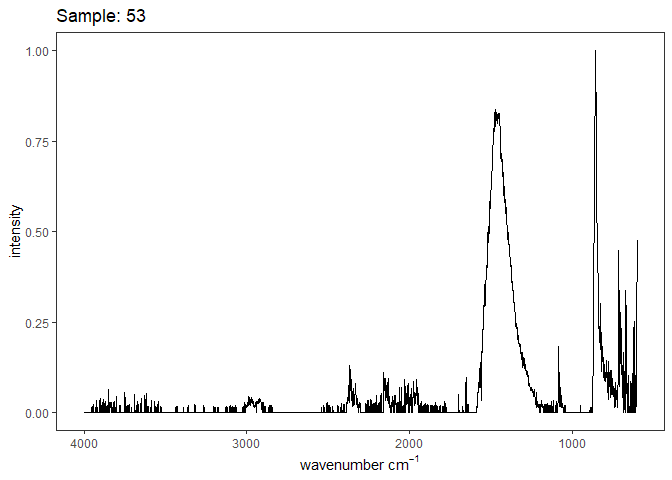
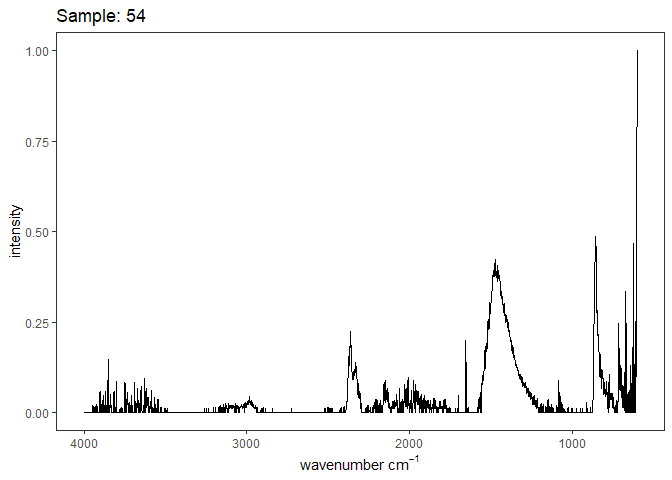
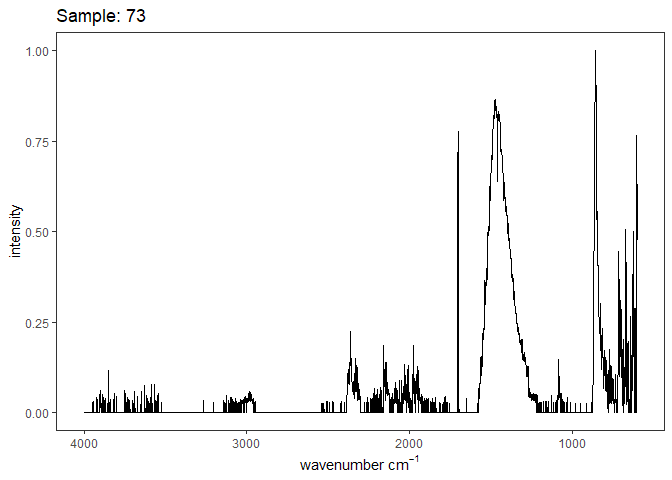
When the data is grouped by the coral genotype, no interesting patterns emerge. There is no shift in the v1-v4 peaks, intensities are fairly consistent, and the FWHM of each peak is also within range for each peak. The asymetrical strethcing of carbonate (v3 peak ~ 1460) had the largest variability with peaks ranging from 1443-1480 and the greatest width 110-156, with the means tightly around 140. The intensity of the v2 to v4 peak was consistently around 3.0, indicating that there was no ACC present in the measured samples given the range of I2/I4 values presented in Beniash et al. 1997.