TGA Analysis of Coral Skeletons
research 15 Sep 2022Overview
Thermogravimetric analysis (TGA) is a quantitative materials technique that linearly heats a sample and simultaneously measures its mass as the sample degrades. By looking at the percent decomposition over discrete regions, we can characterize the coral sample’s fractional constituents. The heating occurs in an inert environment (N2 gas) to avoid sample oxidation.
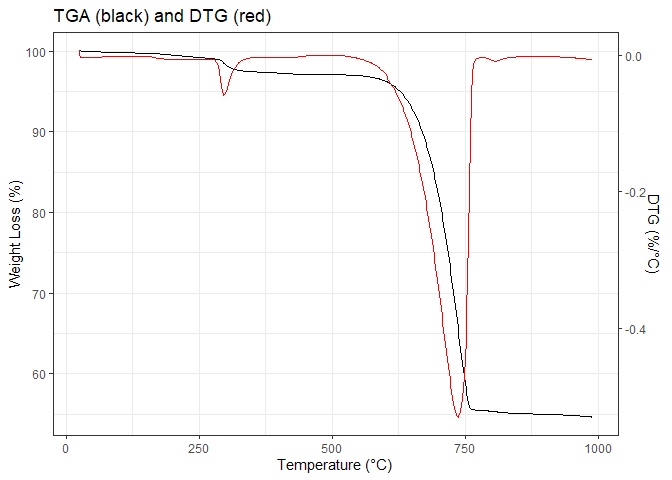
For analysis, we can use the first derivative of the TGA curve (called the DTG curve) to identify the start, peak, and end temperatures for each respective region. Then, we can integrate between the start and end temperatures to calculate the percent degradation. For example, an aragonite coral skeleton may have two peaks: decomposition of the intracrystaline organics at approximately and the decomposition of CaCO3 to CaO and CO2 at approximately 600-800°C (Fig 1.).
Figure 1. Example TGA and DTG Curve
In this document, I review the current coral TGA literature, describe the samples I have tested thus far and the proposed analysis methodology, and begin to analyze my initial results.
Literature Review
There are a handful of publications which have used TGA to analyze coral skeletons grown or collected under acidified environments. The most interesting ones in my opinion are Coronado et al. 2019, Moynihan et al. 2021, and Prada et al. 2021 for their use of the method and the findings they present. A complete list of references I draw upon is included below.
Coronado et al. 2019
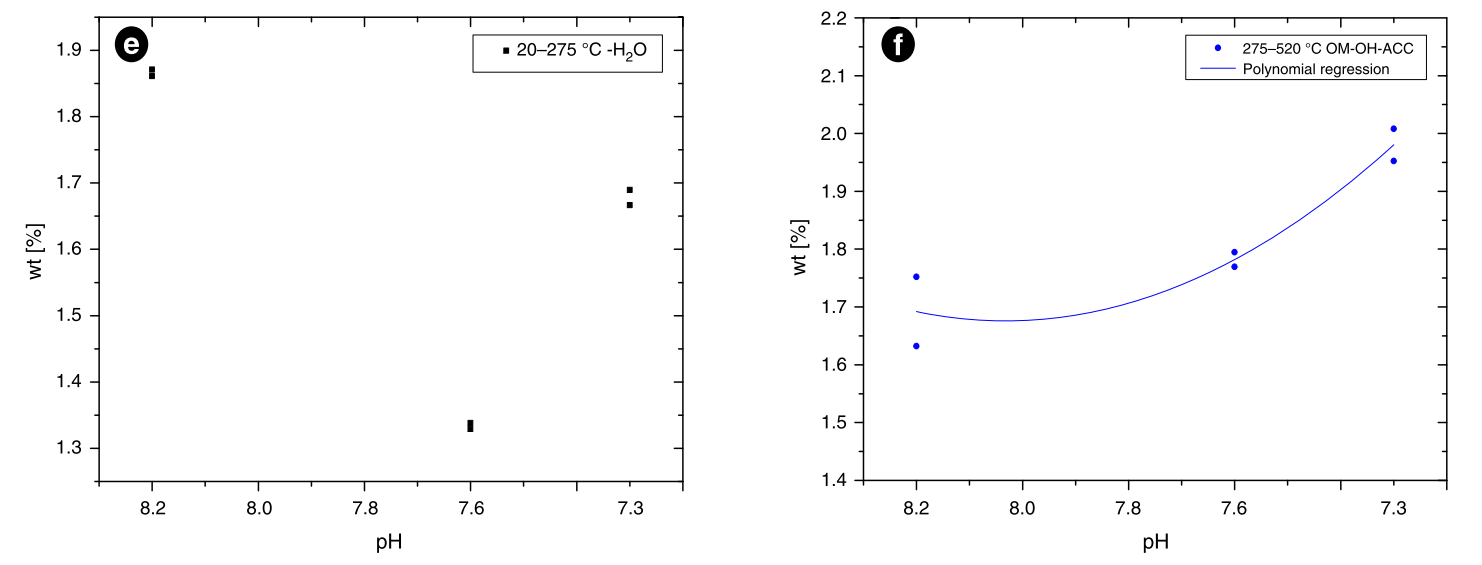
This paper sought to disentangle the biological effects on calcification to make corals a more reliable paleoclimate proxy (i.e. better their understand vital effects). They cultured Stylophora pistillata under pH 8.2, 7.6, and 7.3 and found differences in the aragonite precipitated by the corals under these treatments due to the increased amount of intracrystalline organic matrix and water content as measured by TGA.
They heated at a rate of 10°C/min to 1000°C, but limited their analysis to discrete regions from ambient to 520°C, focusing mainly on the decomposition of water from ambient to 275°C and bulk organic matrix, OH groups, and possible ACC from 275-520°C (Table 1). There was no clear pattern for water, but for the 275-520°C group there was a lineal increase across treatments(Fig. 2).
| Temperature | Name | Reasoning |
|---|---|---|
| 20-150 | Nonstructural water | evaporation of nonstructural water molecules |
| 150-210 | Structural Water | |
| 210-275 | ||
| 275-300 | ||
| 300-330 | ACC | crystallization of ACC, which occurs \~ 316 |
| 330-411 | ||
| 411-440 | transformation of aragonite to calcite, which occurs \~418 | |
| 440-520 | ||
| 20-275 | H2O | Integrates over all nonstructural water |
| 275-520 | OM-OH-ACC | captures all organic matrix, structural water, and ACC crystallization |
Figure 2. TGA Results from Coronado et al. 2019
Moynihan et al. 2021
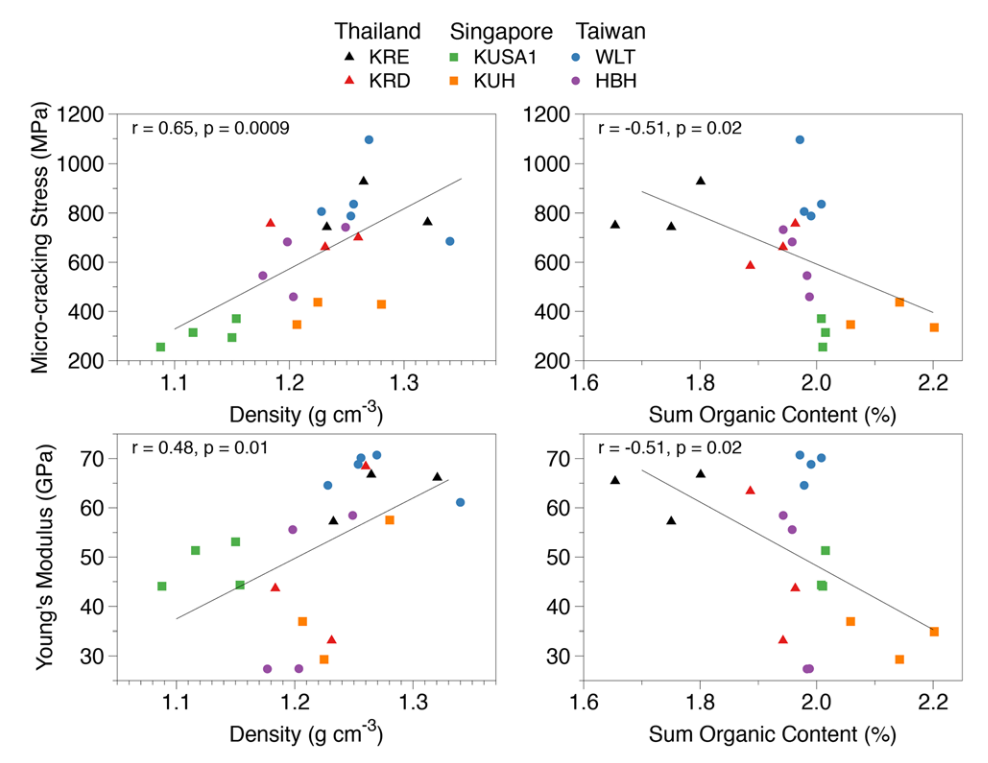
This paper looked at Porites coral cores collected from Thailand, Singapore, and Taiwan and correlated micro-mechanical properties with environmental conditions. They found that corals from low salinity and high sedimentation environments (large freshwater influx) had higher organic content and increased embrittlement.
Their analysis looked at TGA from 20-500°C, which was achieved by heating to a 200C isotherm for 5 minutes followed by a 10°C/min ramp to 400°C and then followed by a 20°C/min ramp to 500°C. They used the DTG curve to identify the temperature of maximum weight loss change (Tmax) and then defined three regions to determine percent change: 175 to 225°C, Tmax-50 - Tmax+50°C, and Tmax+50 to 500°C. They measured micro-mechanical properties with an nanoindentation test.
Figure 3. Regression of micro-mechanical properties and TGA, Moynihan et al. 2019
Prada et al. 2021
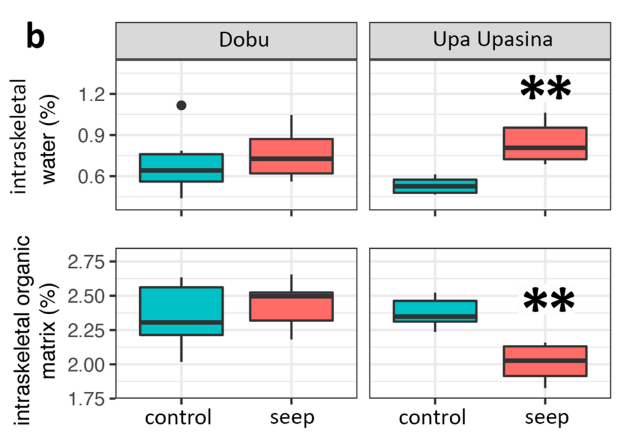
This paper looked at four populations of naturally occurring reefs in Papa New Guinea, two located by a CO2 seep and two nearby control sites. They measured 32 samples in total (10 for each control and seep site at Dobu and 6 for each site at Upa Upasina). Their analysis looked at TGA from 20-600°C at 10°C/min incremeents with a 120°C istotherm for 5 minutes to stabalize the removal of adsorbed water. They then focussed their analysis on the region from 125-250°C (structured water molecules) and 250-470°C (organix matrix).
They only found significant differences between sites in intraskeletal strucutred water and intraskeletal OM at Upa Upasina, suggesting that differences may not be solely environmentally controlled and their may be physiological control of these parameters which are different between different populations. Though further evidence to support this claim is not presented here.
Figure 4. TGA Results from Prada et al. 2021
Takeaways
Each of these papers analyzed TGA data slightly differently. However, there is general agreement in the organic matrix limits (250-470°C) and the structural water limits (150-225°C). There is potentially other regions of interest too including the crystallization of ACC (300-330°C, ~316°C) and the monotropic transformation of aragonite to calcite (411-440°C, ~418°C). See section below where I propose the analysis I will undertake.
References
- Coronado, I., Fine, M., Bosellini, F. R. & Stolarski, J. Impact of ocean acidification on crystallographic vital effect of the coral skeleton. Nat. Commun. 10, 1–9 (2019).
- Cuif, J. P., Dauphin, Y. Y., Doucet, J., Salome, M. & Susini, J. XANES mapping of organic sulfate in three scleractinian coral skeletons. Geochim. Cosmochim. Acta 67, 75–83 (2003).
- Cuif, J. P. et al. Fine-scale growth patterns in coral skeletons: Biochemical control over crystallization of aragonite fibres and assessment of early diagenesis. Geol. Soc. Spec. Publ. 303, 87–96 (2008).
- Cuif, J. P., Dauphin, Y., Berthet, P. & Jegoudez, J. Associated water and organic compounds in coral skeletons: Quantitative thermogravimetry coupled to infrared absorption spectrometry. Geochemistry, Geophys. Geosystems 5, 1–9 (2004).
- Dauphin, Y., Cuif, J. P. & Massard, P. Persistent organic components in heated coral aragonitic skeletons-Implications for palaeoenvironmental reconstructions. Chem. Geol. 231, 26–37 (2006).
- Falini, G. et al. Control of aragonite deposition in colonial corals by intra-skeletal macromolecules. J. Struct. Biol. 183, 226–238 (2013).
- Goffredo, S. et al. Biomineralization control related to population density under ocean acidification. Nat. Clim. Chang. 4, 593–597 (2014).
- Moynihan, M. A. et al. Environmental impact on the mechanical properties of Porites spp. corals. Coral Reefs 40, 701–717 (2021).
- Pasquini, L. et al. Isotropic microscale mechanical properties of coral skeletons. J. R. Soc. Interface 12, 1–9 (2015).
- Prada, F. et al. Coral micro- and macro-morphological skeletal properties in response to life-long acclimatization at CO2 vents in Papua New Guinea. Sci. Rep. 11, 1–10 (2021).
- Reggi, M. et al. Biomineralization in mediterranean corals: The role of the intraskeletal organic matrix. Cryst. Growth Des. 14, 4310–4320 (2014).
- Schmidt, M. P., Ilott, A. J., Phillips, B. L. & Reeder, R. J. Structural changes upon dehydration of amorphous calcium carbonate. Cryst. Growth Des. 14, 938–951 (2014).
- Stolarski, J. & Mazur, M. Nanostructure of biogenic versus abiogenic calcium carbonate crystals. Acta Palaeontol. Pol. 50, 847–865 (2005).
Samples
The corals for this first batch of analysis come from Allyson Demerlis’s recent project where she investigated gene expression during a rapid bleaching experiment of 3 Acropora cervicornis genotypes. Some of the corals underwent a thermal stress-hardening treatment where the corals were exposed to a daily variable temperature which is believed to increase a coral’s bleaching resilience. The corals exposed to the high temperatures (36°C) had high amounts of mortality and I took these skeletons to analyze.
Figure 5. Calcification data from Allyson Demerlis’s project
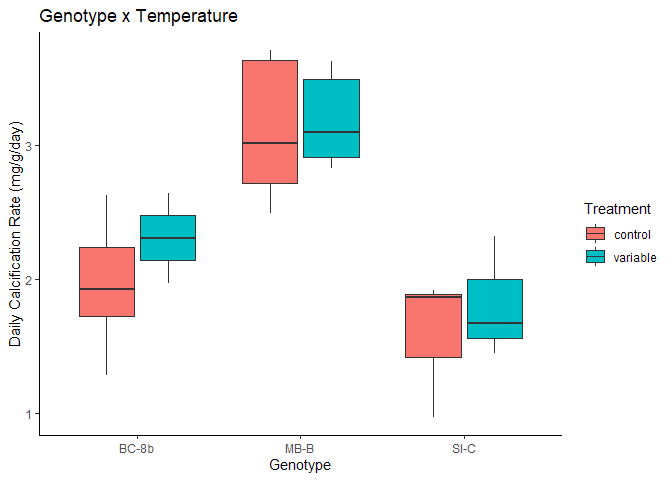
There was a significant effect of the coral genotype (F=23.27, p=7.78e-6), but no observed effect of stress hardening treatment on calcification rates (F=0.91, p=0.352). Following post-hoc testing, the significant genotype effect was driven by genotype MB-B which had much higher rates than BC-8B and SI-C which had similar calcification rates.
Thus, we are conducting these tests with a special focus on genotype MB-B to see if its faster calcification rate results in any observable differences in skeletal properties.
Proposed Analysis
With the reviewed literature above, I synthesized the analysis I plan to conduct with the goals of 1) automating the analysis; 2) characterizing the structural water, organic matrix, ACC, aragonite to calcite, and calcium carbonate regions; and 3) analyzing if there are any propertie conserved among genotypes.
Programatic Analysis
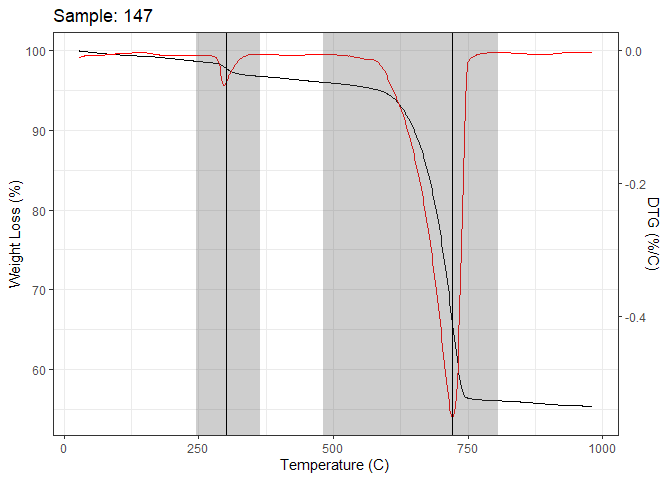
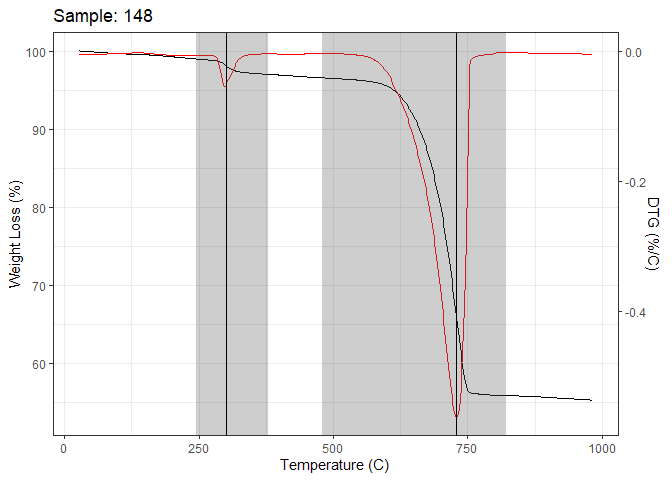
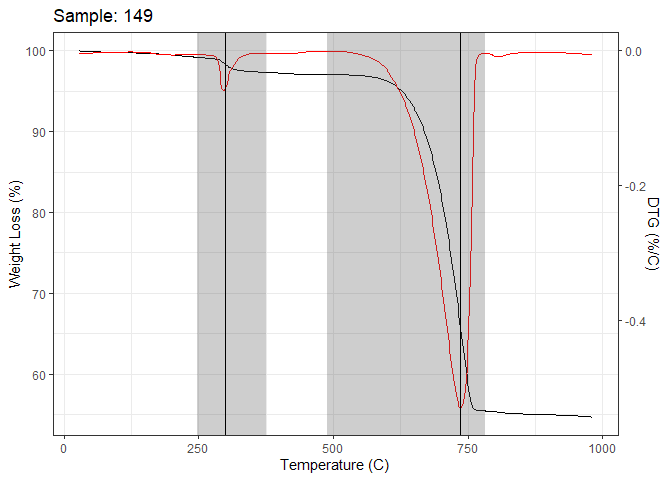
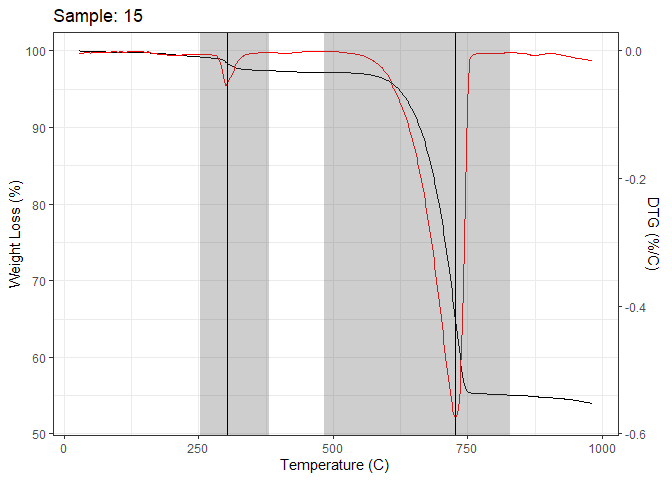
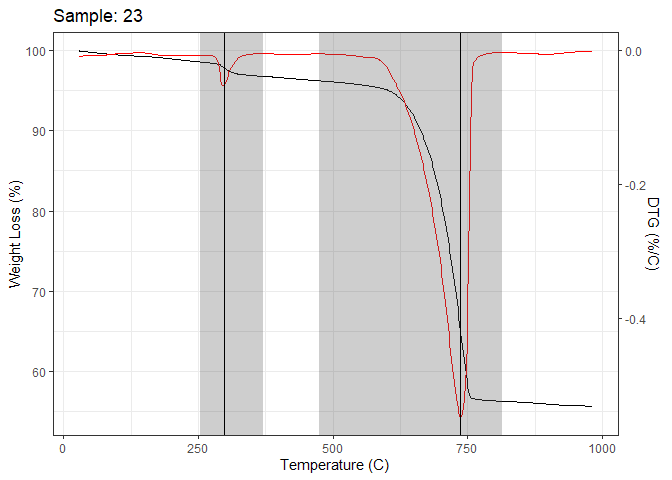
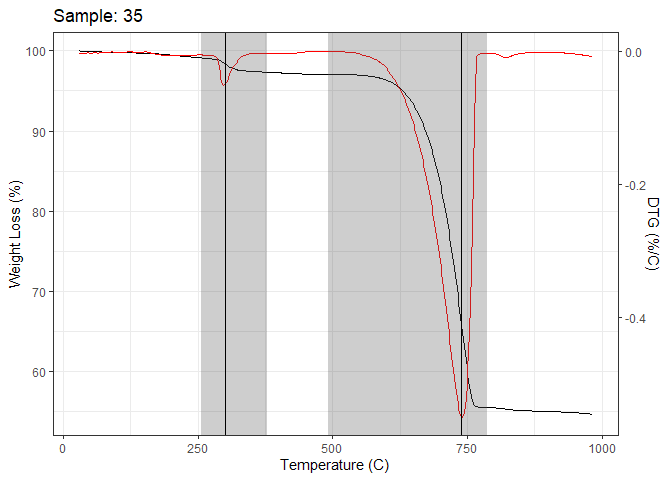
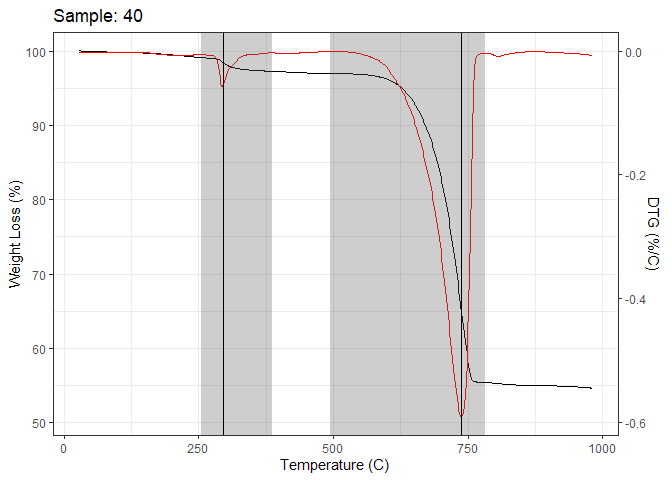
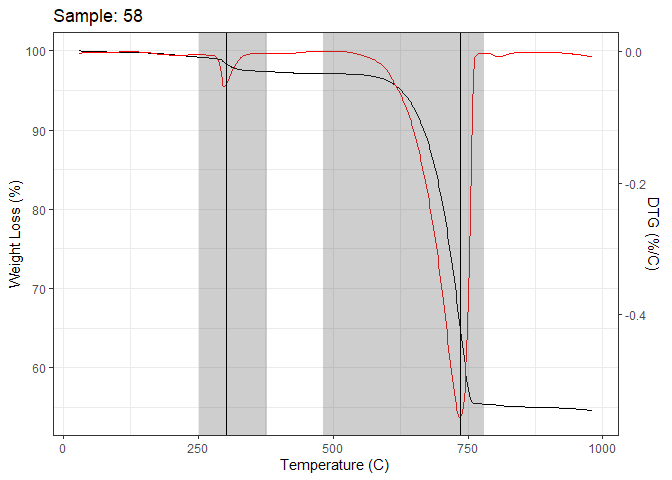
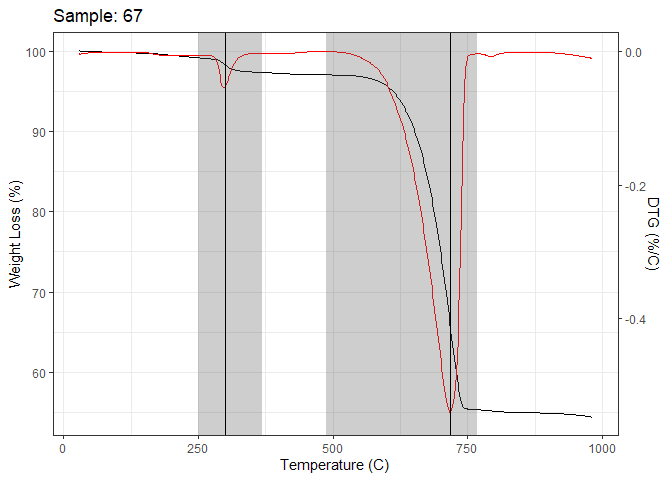
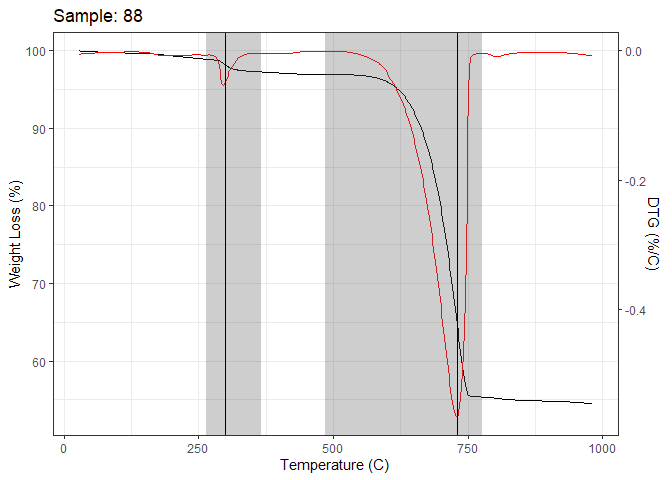
The first way I will analyze will be to find inflection points of the DTG curve to identify the start, peak, and stop of the organc matrix region between 240 and 450°C and the calcium carbonate region between 450 and 850°C. I first calculate the second derivative of the TGA curve and identify all points of inflection (f’’ goes from positive to negative). In theory there should only be three points of inflection denoting the start, peak, and stop of the DTG curve. However, due to noise within the data, there is often instances where there is five or more points of inflection. To counteract that, I also run a cumulative minimum function to find the minimum of the DTG curve which corresponds to the peak. I then find the 3 values within the returned point of inflection which center around the peak.
Here is an example. My inflection function returns the values 12,10,7,6,9,10,12. And the cummin function returns the value 6. I center this around the inflection point and extract 7,6, and 9.
This removes the observed noise and when graphed below, you can see that the extract points correspond with the inflection points you can visualize.
The other ways I will analyze the data will be over discrete intervals including,
- Non structural water (40-150)
- Structural water (125-250)
- Total water (40-250)
- Organic matrix (250-470)
- Crystallization of ACC (300-330)
- Aragonite to Calcite Transformation (411-440)
- Organic Matrix + ACC + OH Groups (275-520)
- CaCO3 (600-800)
Initial Results
[[1]]
 [[2]]
[[2]]
 [[3]]
[[3]]
 [[4]]
[[4]]
 [[5]]
[[5]]
 [[6]]
[[6]]
 [[7]]
[[7]]
 [[8]]
[[8]]
 [[9]]
[[9]]
 [[10]]
| sample | region | start | peak | stop | loss |
|---|---|---|---|---|---|
| 147 | caco3 | 481.04 | 721.23 | 806.28 | 39.953 |
| 148 | caco3 | 480.22 | 728.76 | 822.17 | 40.729 |
| 149 | caco3 | 489.67 | 736.54 | 783.31 | 41.623 |
| 15 | caco3 | 483.64 | 727.17 | 828.90 | 42.146 |
| 23 | caco3 | 474.82 | 736.70 | 813.37 | 39.913 |
| 35 | caco3 | 492.03 | 738.92 | 787.37 | 41.630 |
| 40 | caco3 | 494.61 | 738.14 | 783.18 | 41.561 |
| 58 | caco3 | 482.51 | 736.05 | 781.15 | 41.728 |
| 67 | caco3 | 488.29 | 718.48 | 768.58 | 41.672 |
| 88 | caco3 | 485.81 | 729.35 | 776.11 | 41.586 |
| 147 | organics | 245.99 | 300.97 | 364.31 | 1.891 |
| 148 | organics | 245.19 | 301.84 | 378.50 | 1.965 |
| 149 | organics | 247.95 | 299.61 | 376.28 | 1.865 |
| 15 | organics | 253.59 | 303.58 | 381.91 | 1.780 |
| 23 | organics | 253.12 | 298.10 | 369.77 | 1.786 |
| 35 | organics | 255.31 | 300.30 | 378.63 | 1.789 |
| 40 | organics | 254.55 | 296.21 | 387.88 | 1.860 |
| 58 | organics | 252.46 | 302.45 | 379.12 | 1.827 |
| 67 | organics | 249.91 | 299.89 | 368.22 | 1.826 |
| 88 | organics | 264.10 | 299.09 | 365.75 | 1.638 |
Stats
Figure 6. Genotype Specific Percent Loss
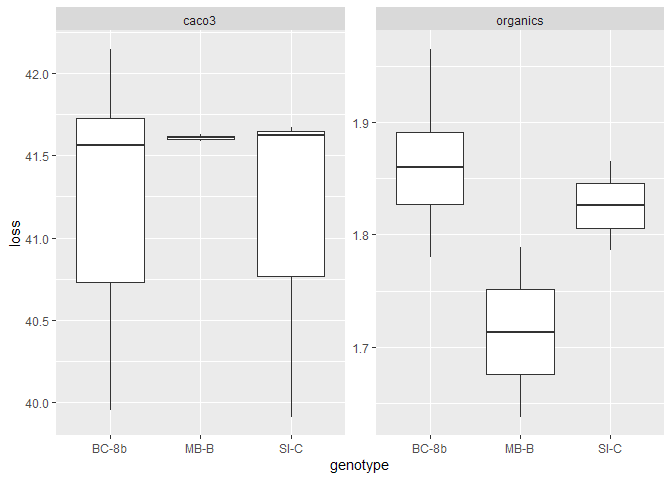 The organics figure looks like MB-B has a slight difference, but looking
at the y axis its median is only 7% less than the median of the other
two genotypes and currently not showing significant genotype differences
(F=3.372, p=0.094). However, we still have a handful of more samples to
run. FTIR analysis may help classify the specific differences rather
than bulk concentration of organics quantified here.