Initial MAT Growth Rates
research 20 Dec 2023Overview
Below is a quick analysis of the growth rates from the mineral accretion technology (MAT) experiment. After initial kinks were ironed out, there was about one month of growth data recorded weekly, from November 14 to December 15.
Since some abiotic precipitate was knocked loose during each weighing session generating non-linear growth, I used the mass change between consecutive weighing sessions to calculate a daily growth rate for each week. This analysis method may require me to revisit the statistics since I am artificially inflating the n for each group (e.g., there’s only 8 corals per group per tank, but I have about about 30 daily growth rates when combining multiple weighing sessions). A repeated-measurements anova design is more appropriate for this type of analysis. However, I would expect this revised analysis to increase p-values, further supporting my conclusions (i.e. lack of statistically significant differences between groups).
Controls
How did control acrylic corals grow?
Figure 1. Acrylic Controls Daily Mass Gain
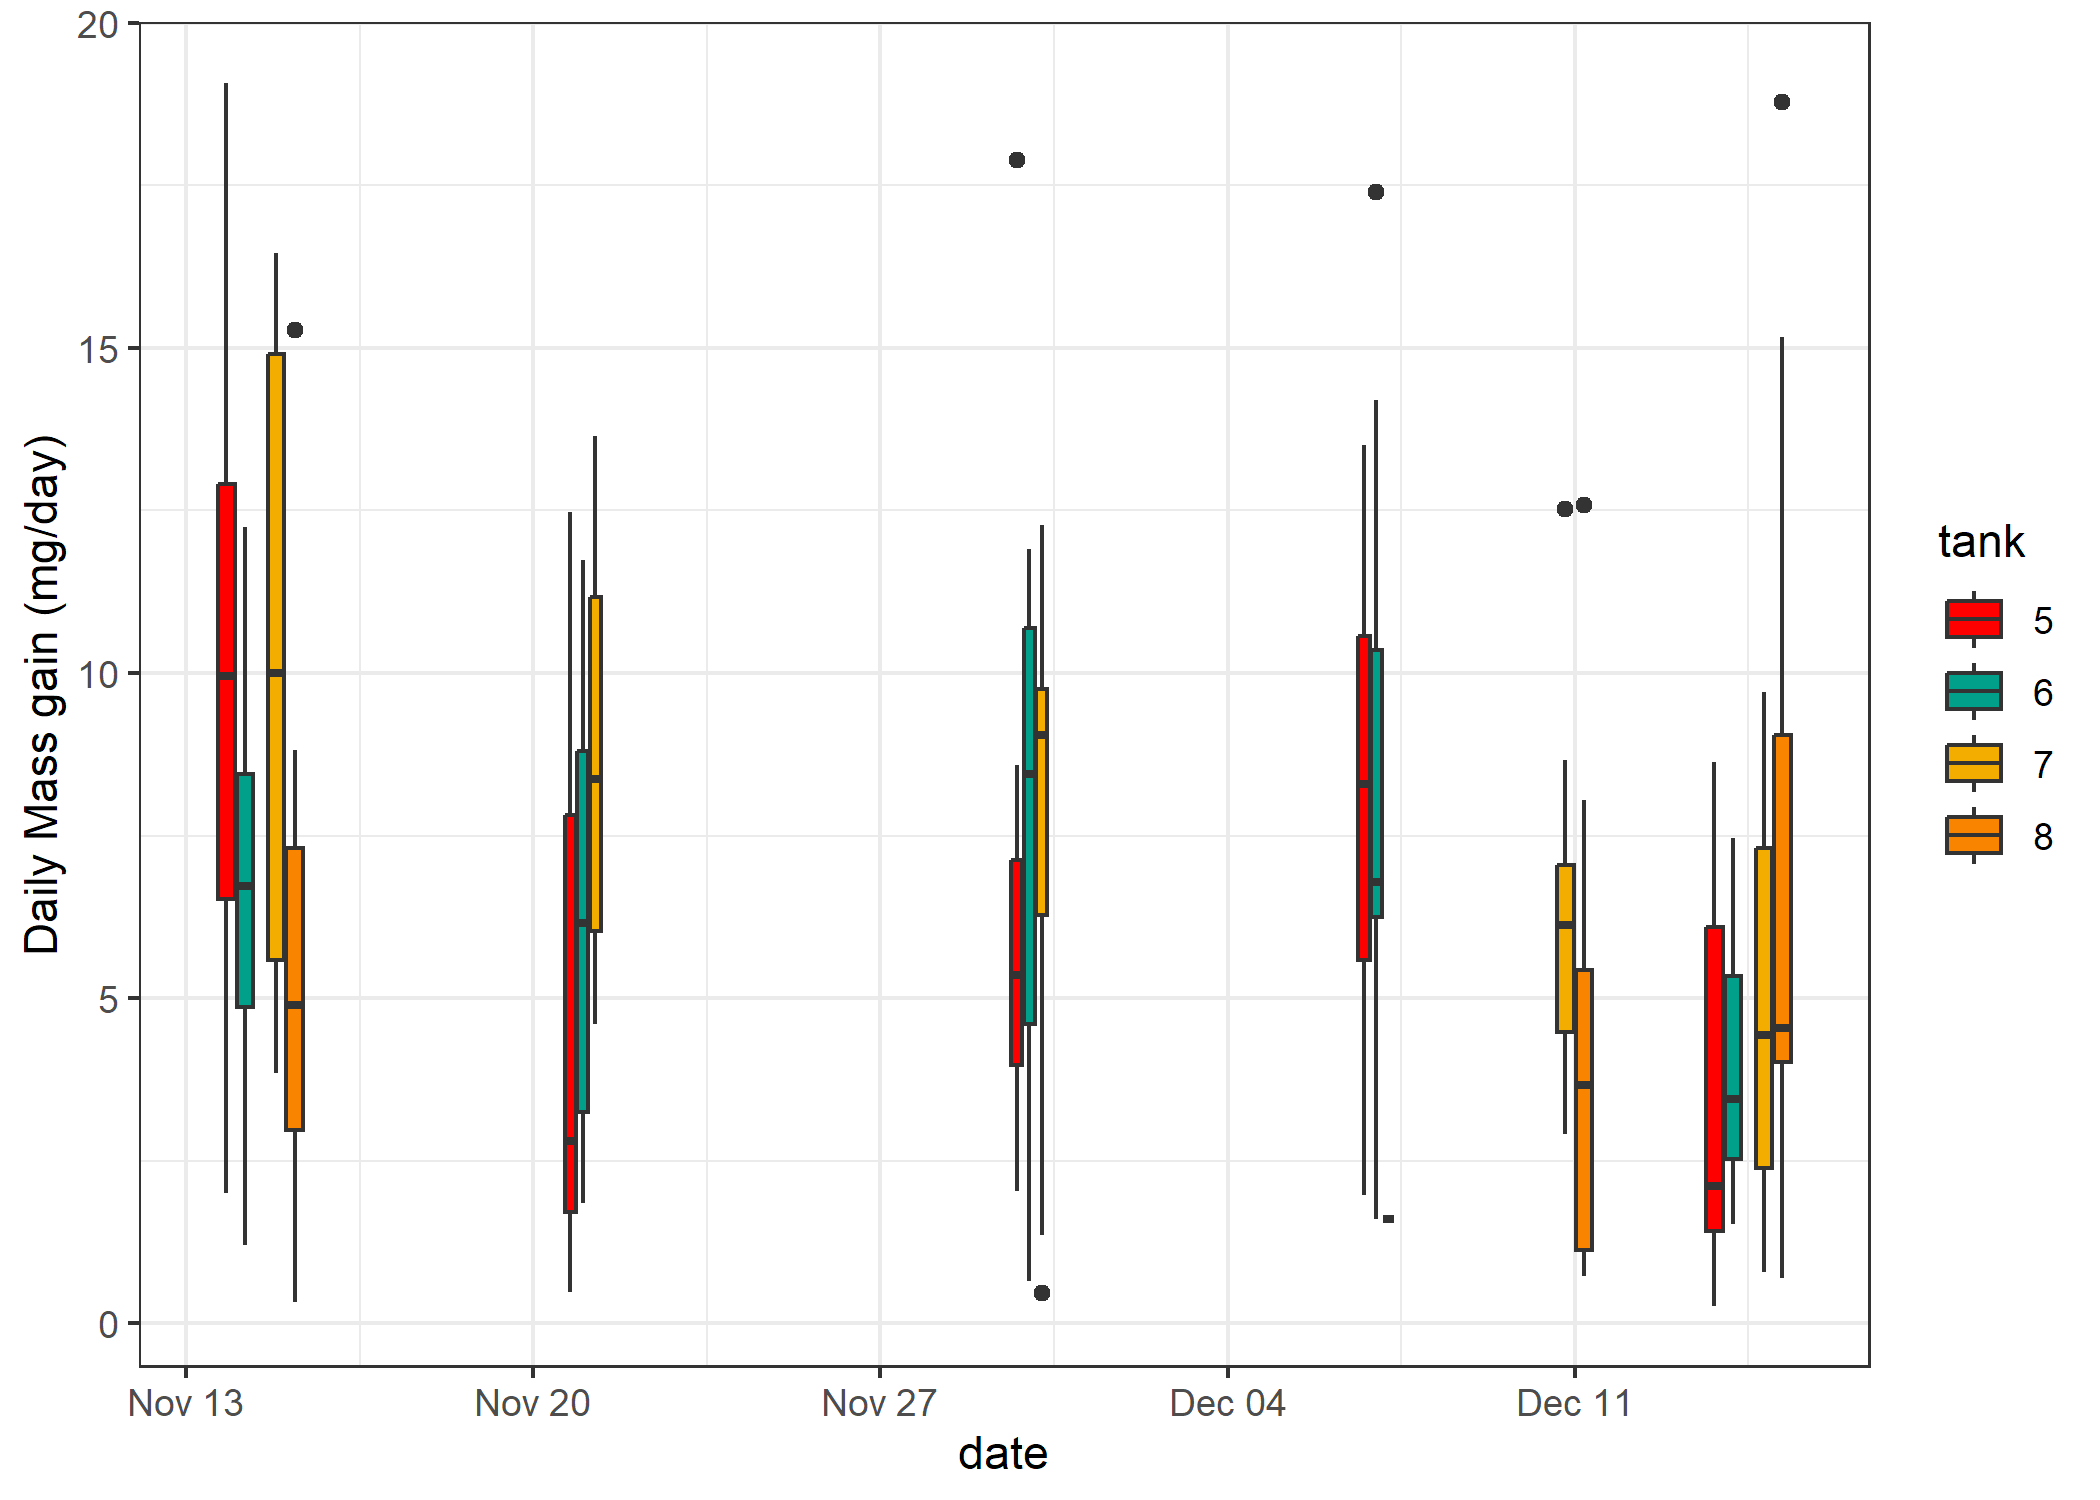
Figure 2. Acrylic Controls Daily Mass Gain by Tank
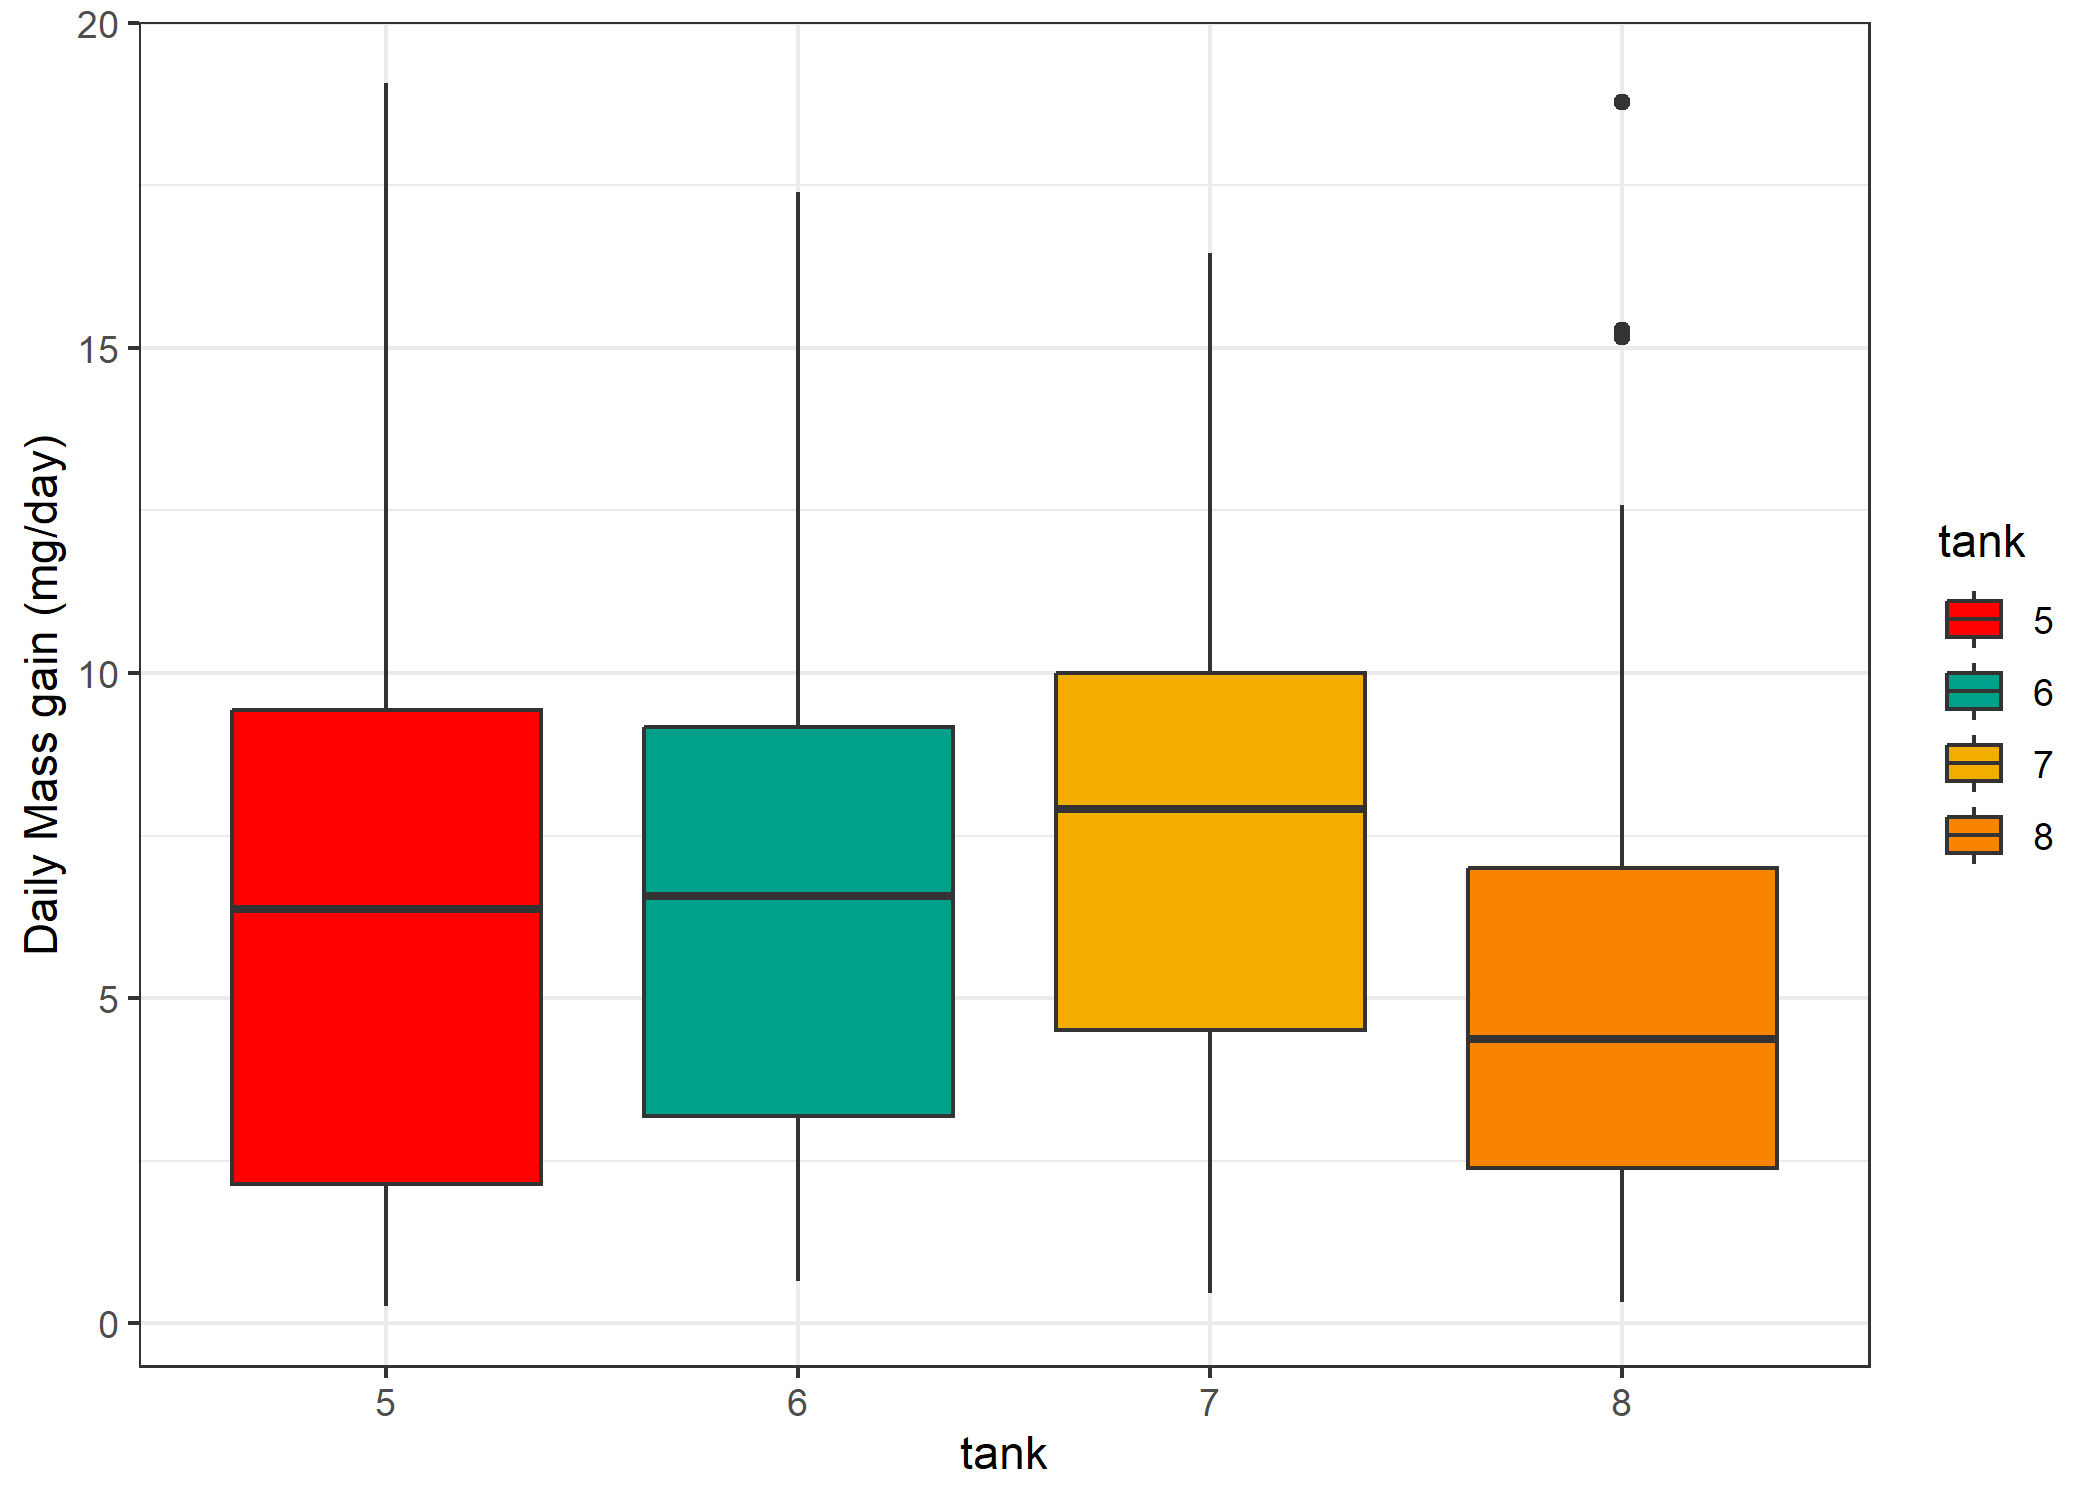
Figure 3. Acrylic Controls Standardized Daily Growth Rate by Tank
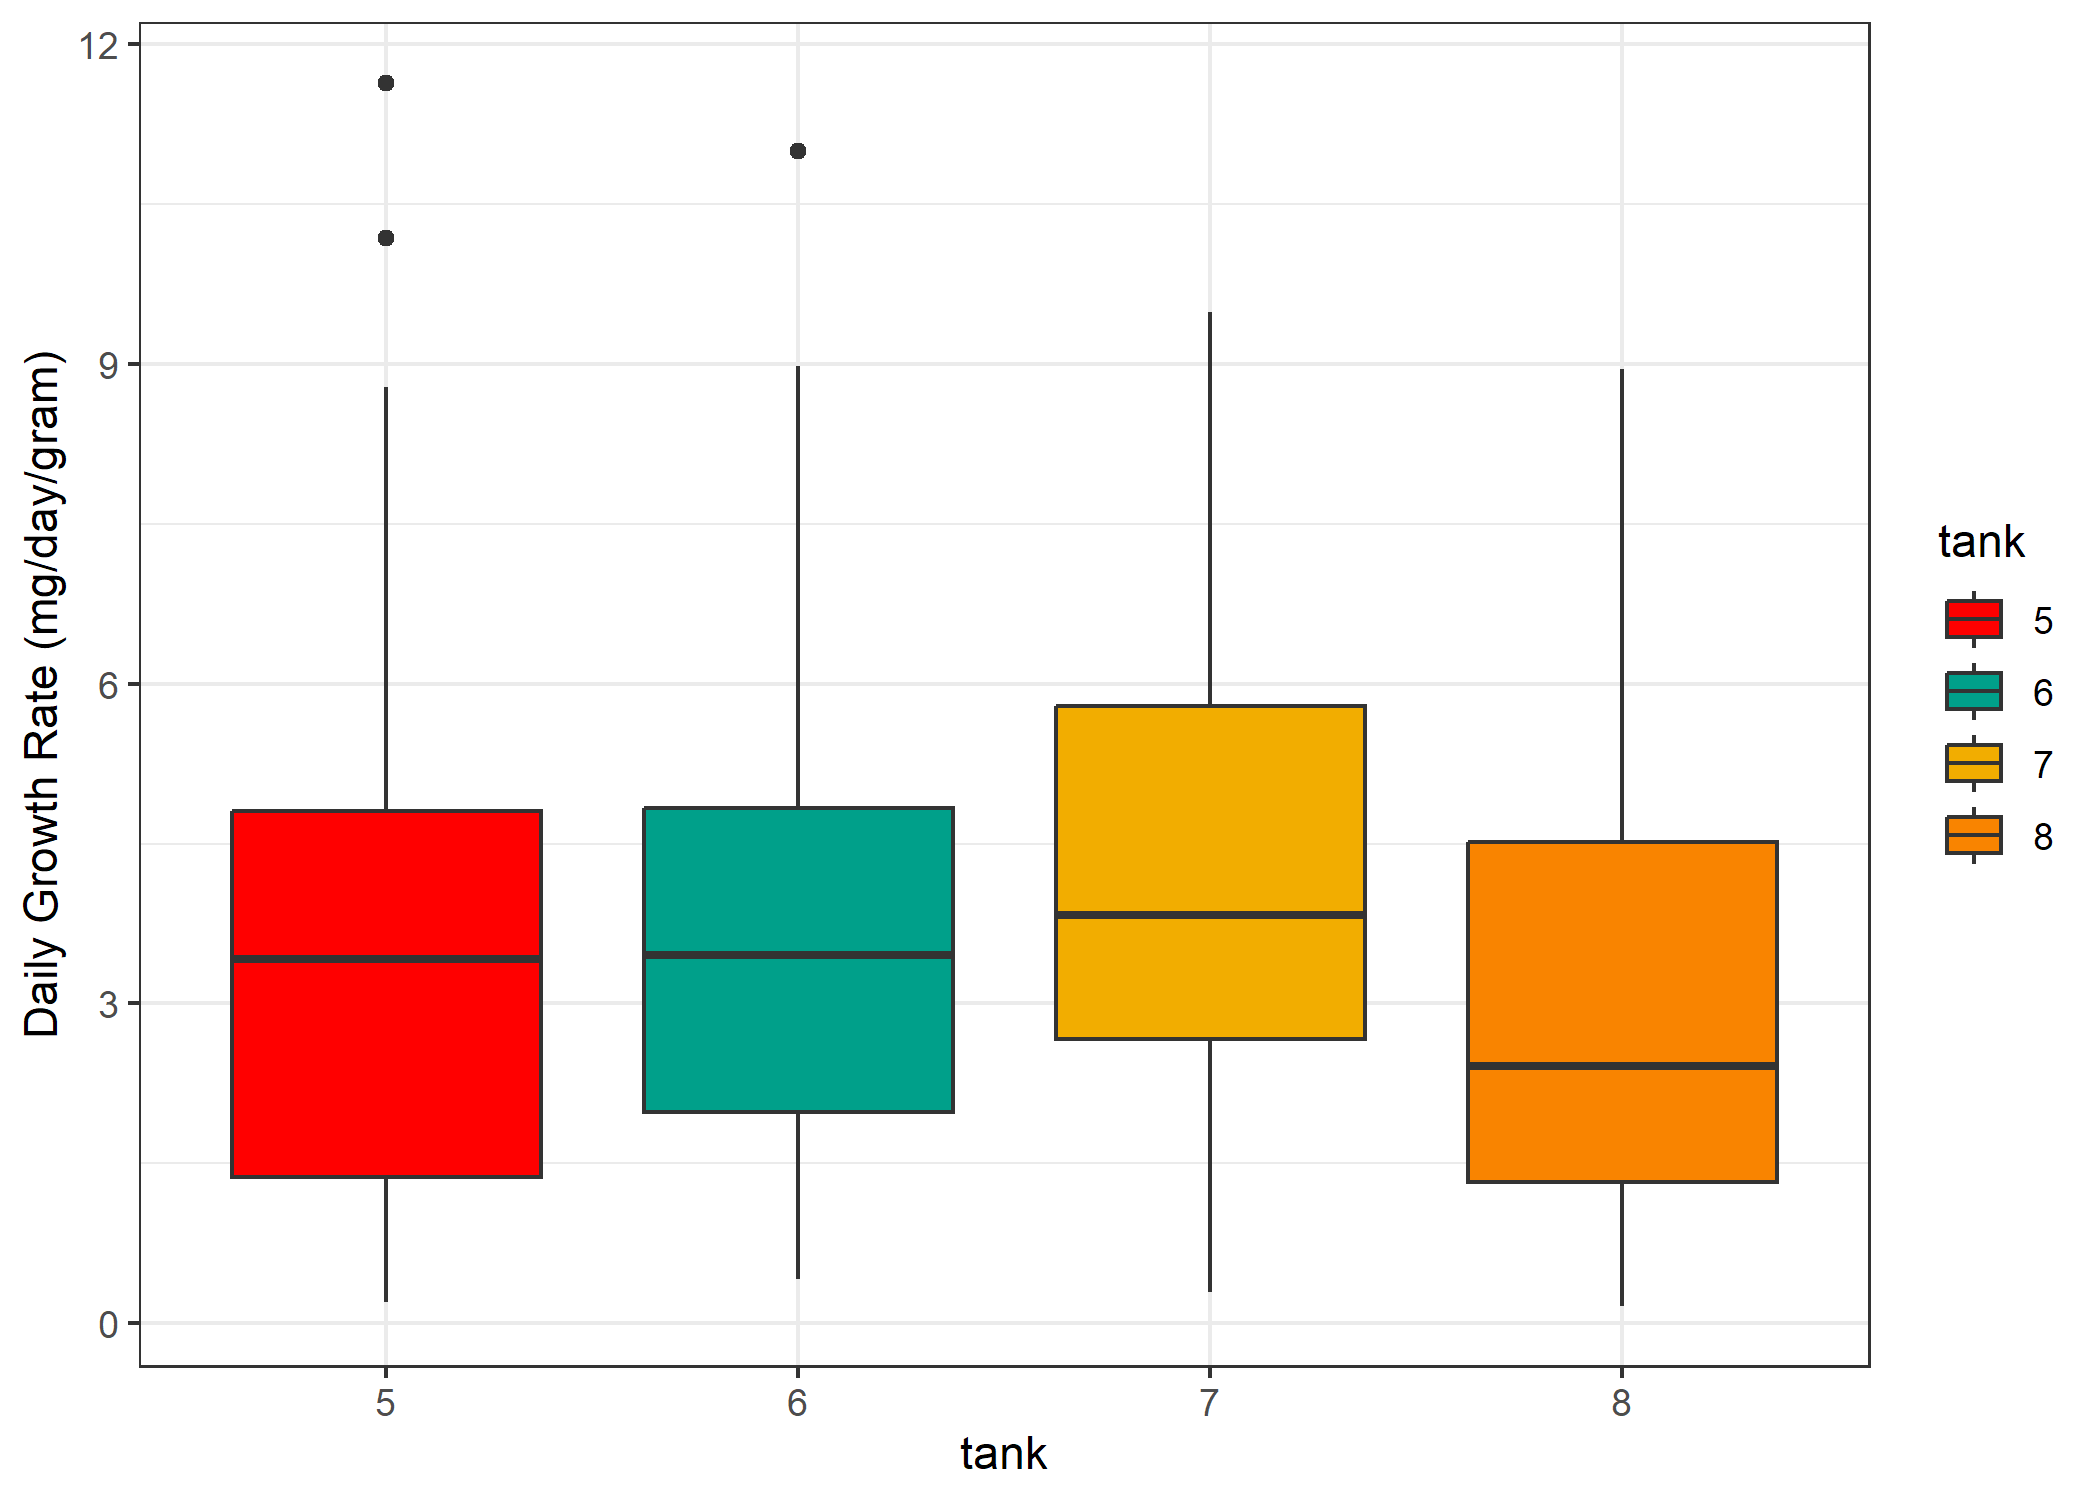 The average daily increase in mass of the control corals growing on an
inert, acrylic plug was 6.702 mg/day, 95% CI [5.963, 7.44].
We can further initial-mass standardize these growth rates to the the initial mass of each fragment since I don’t have the surface areas just yet, i.e. Figure 3 above, to produce an average daily growth rate of 3.75 mg/day/ initial g, 95% CI[3.331, 4.17]. The same conclusions are drawn regardless of the standardization chosen, likely because the corals are evenly mixed and of the approximate same size.
How did the control MAT plugs abiotically grow?
Figure 4. All MAT Controls Daily Mass Gain by Date
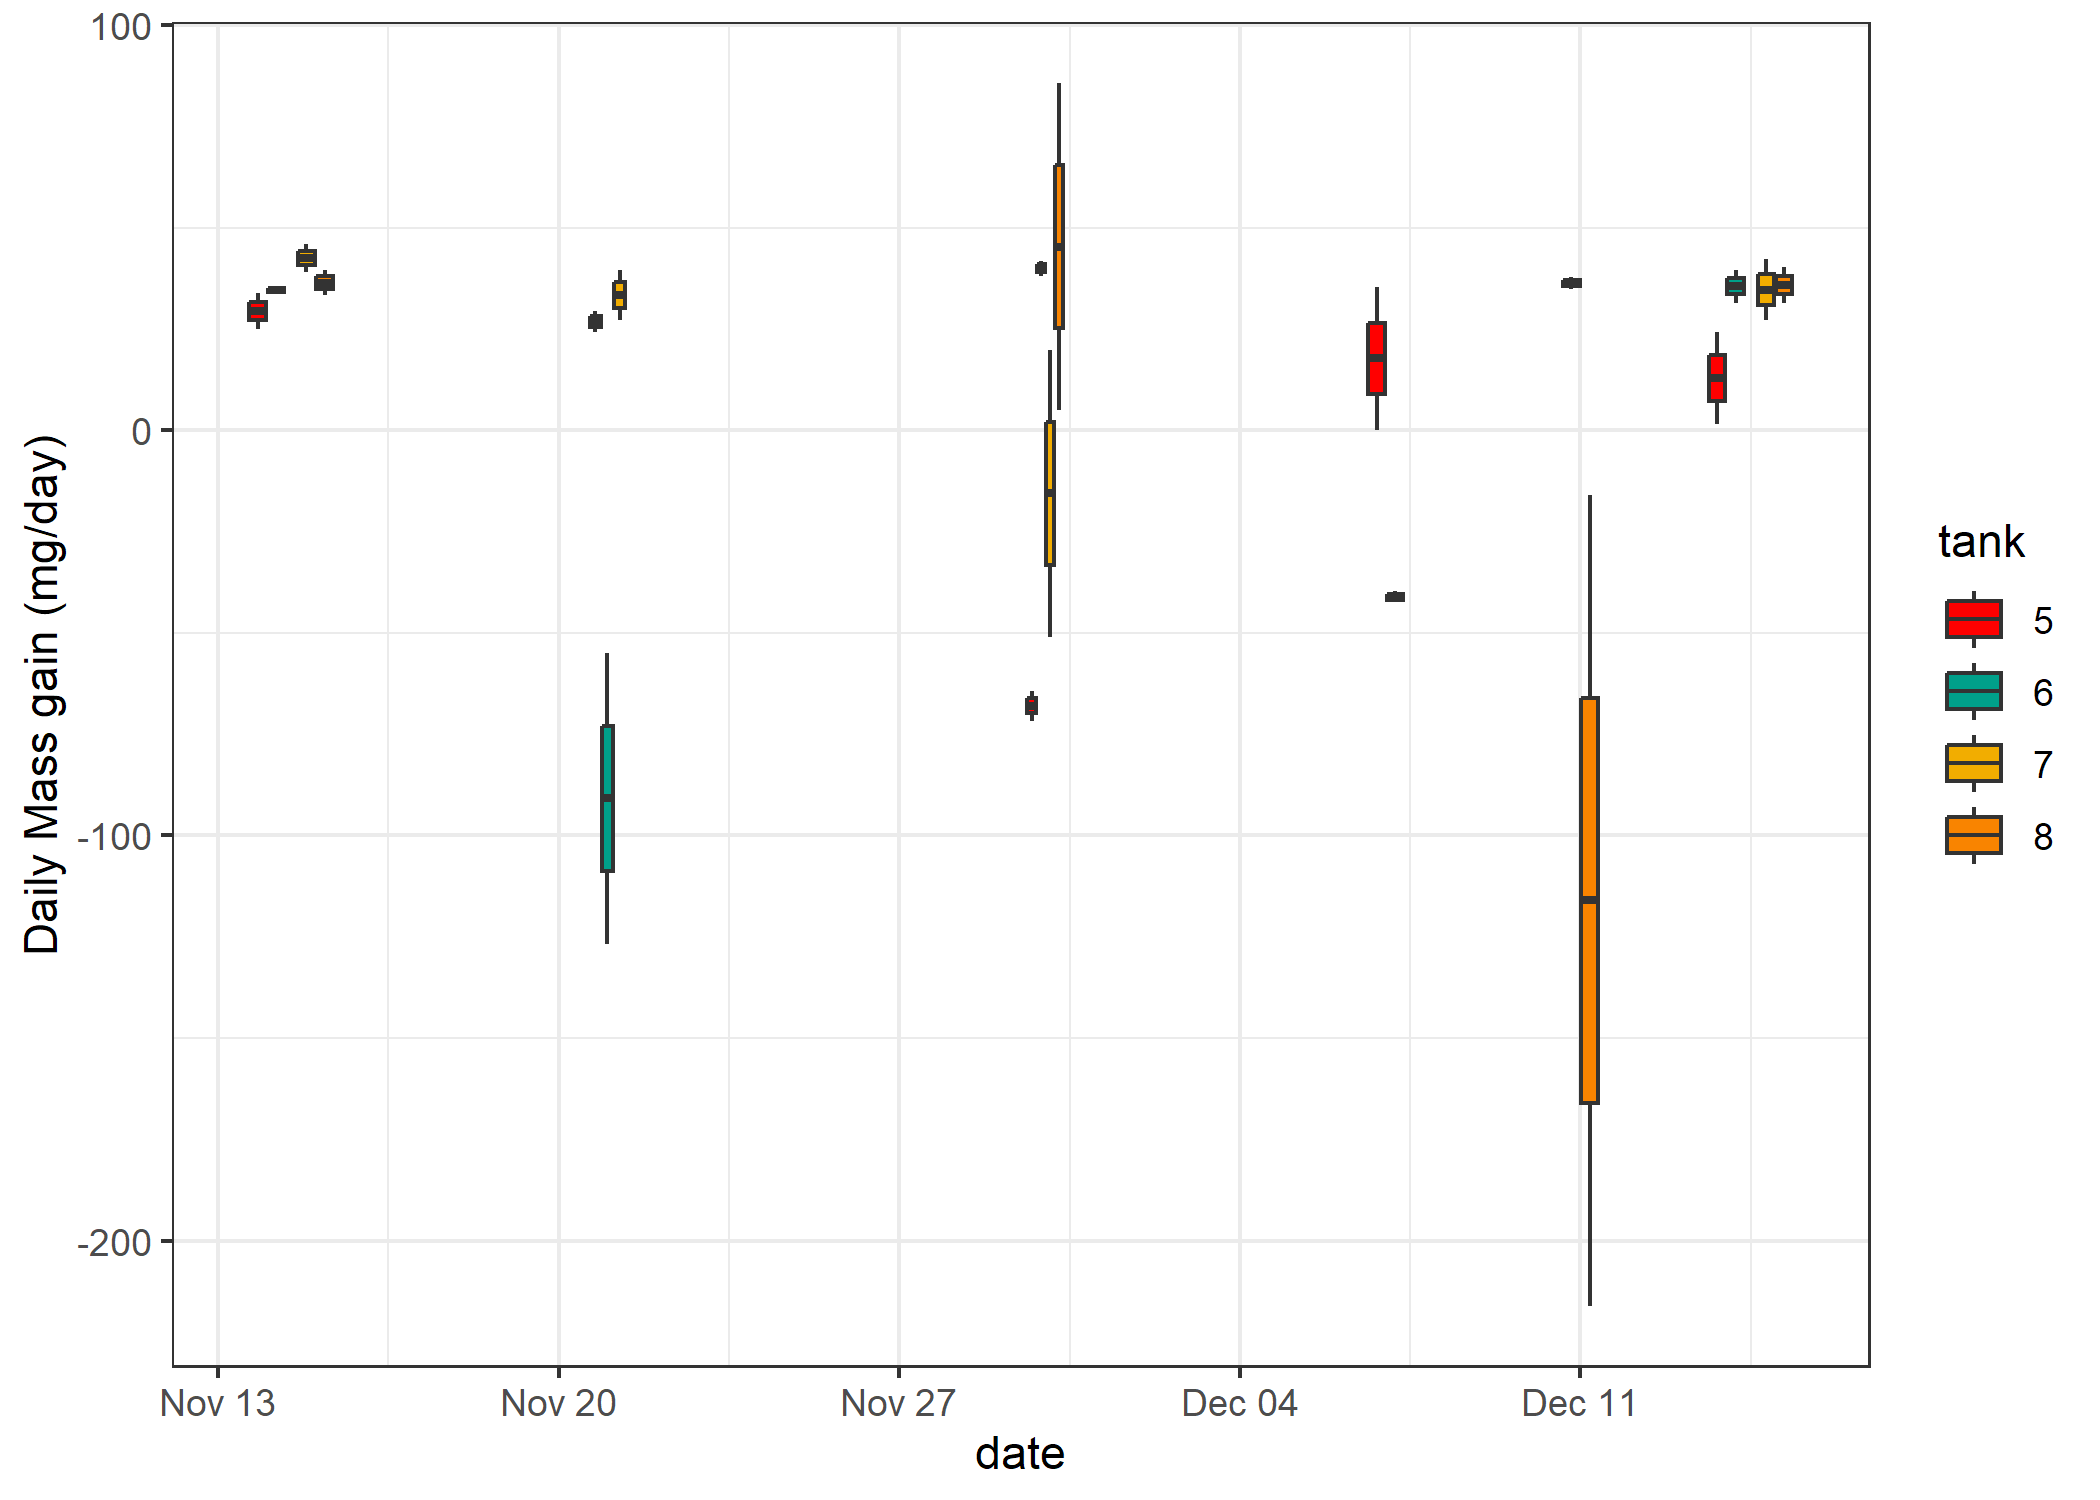
Figure 5. Filtered MAT Controls Daily Mass Gain by Date
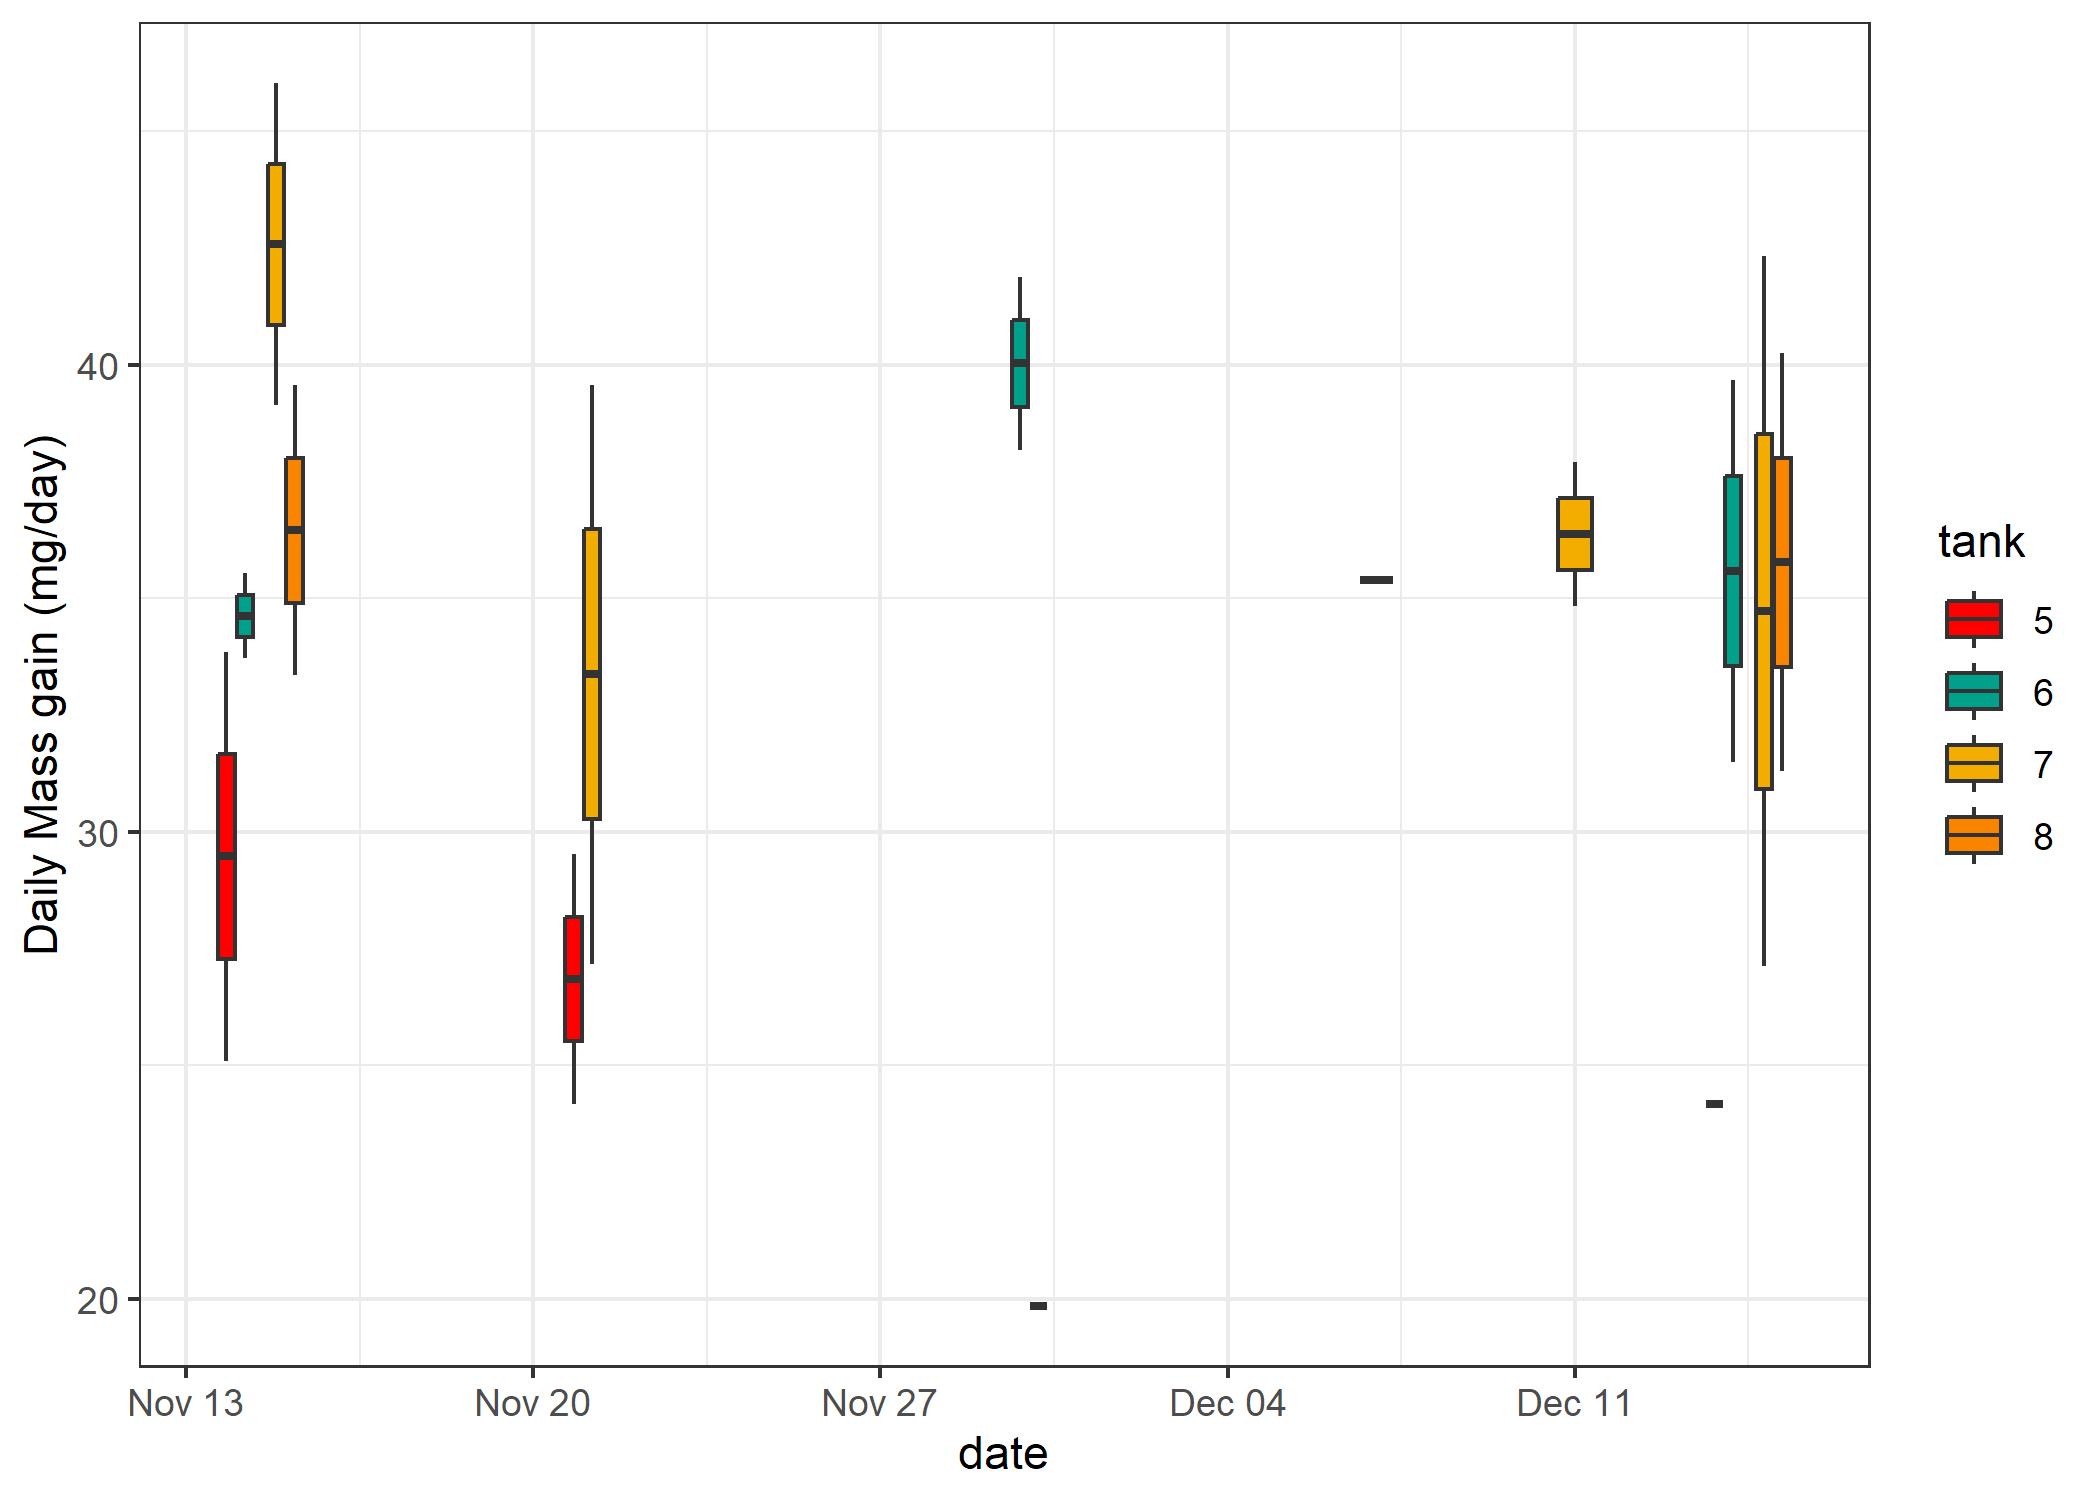
Figure 6. Filtered MAT Controls Daily Mass Gain by Tank
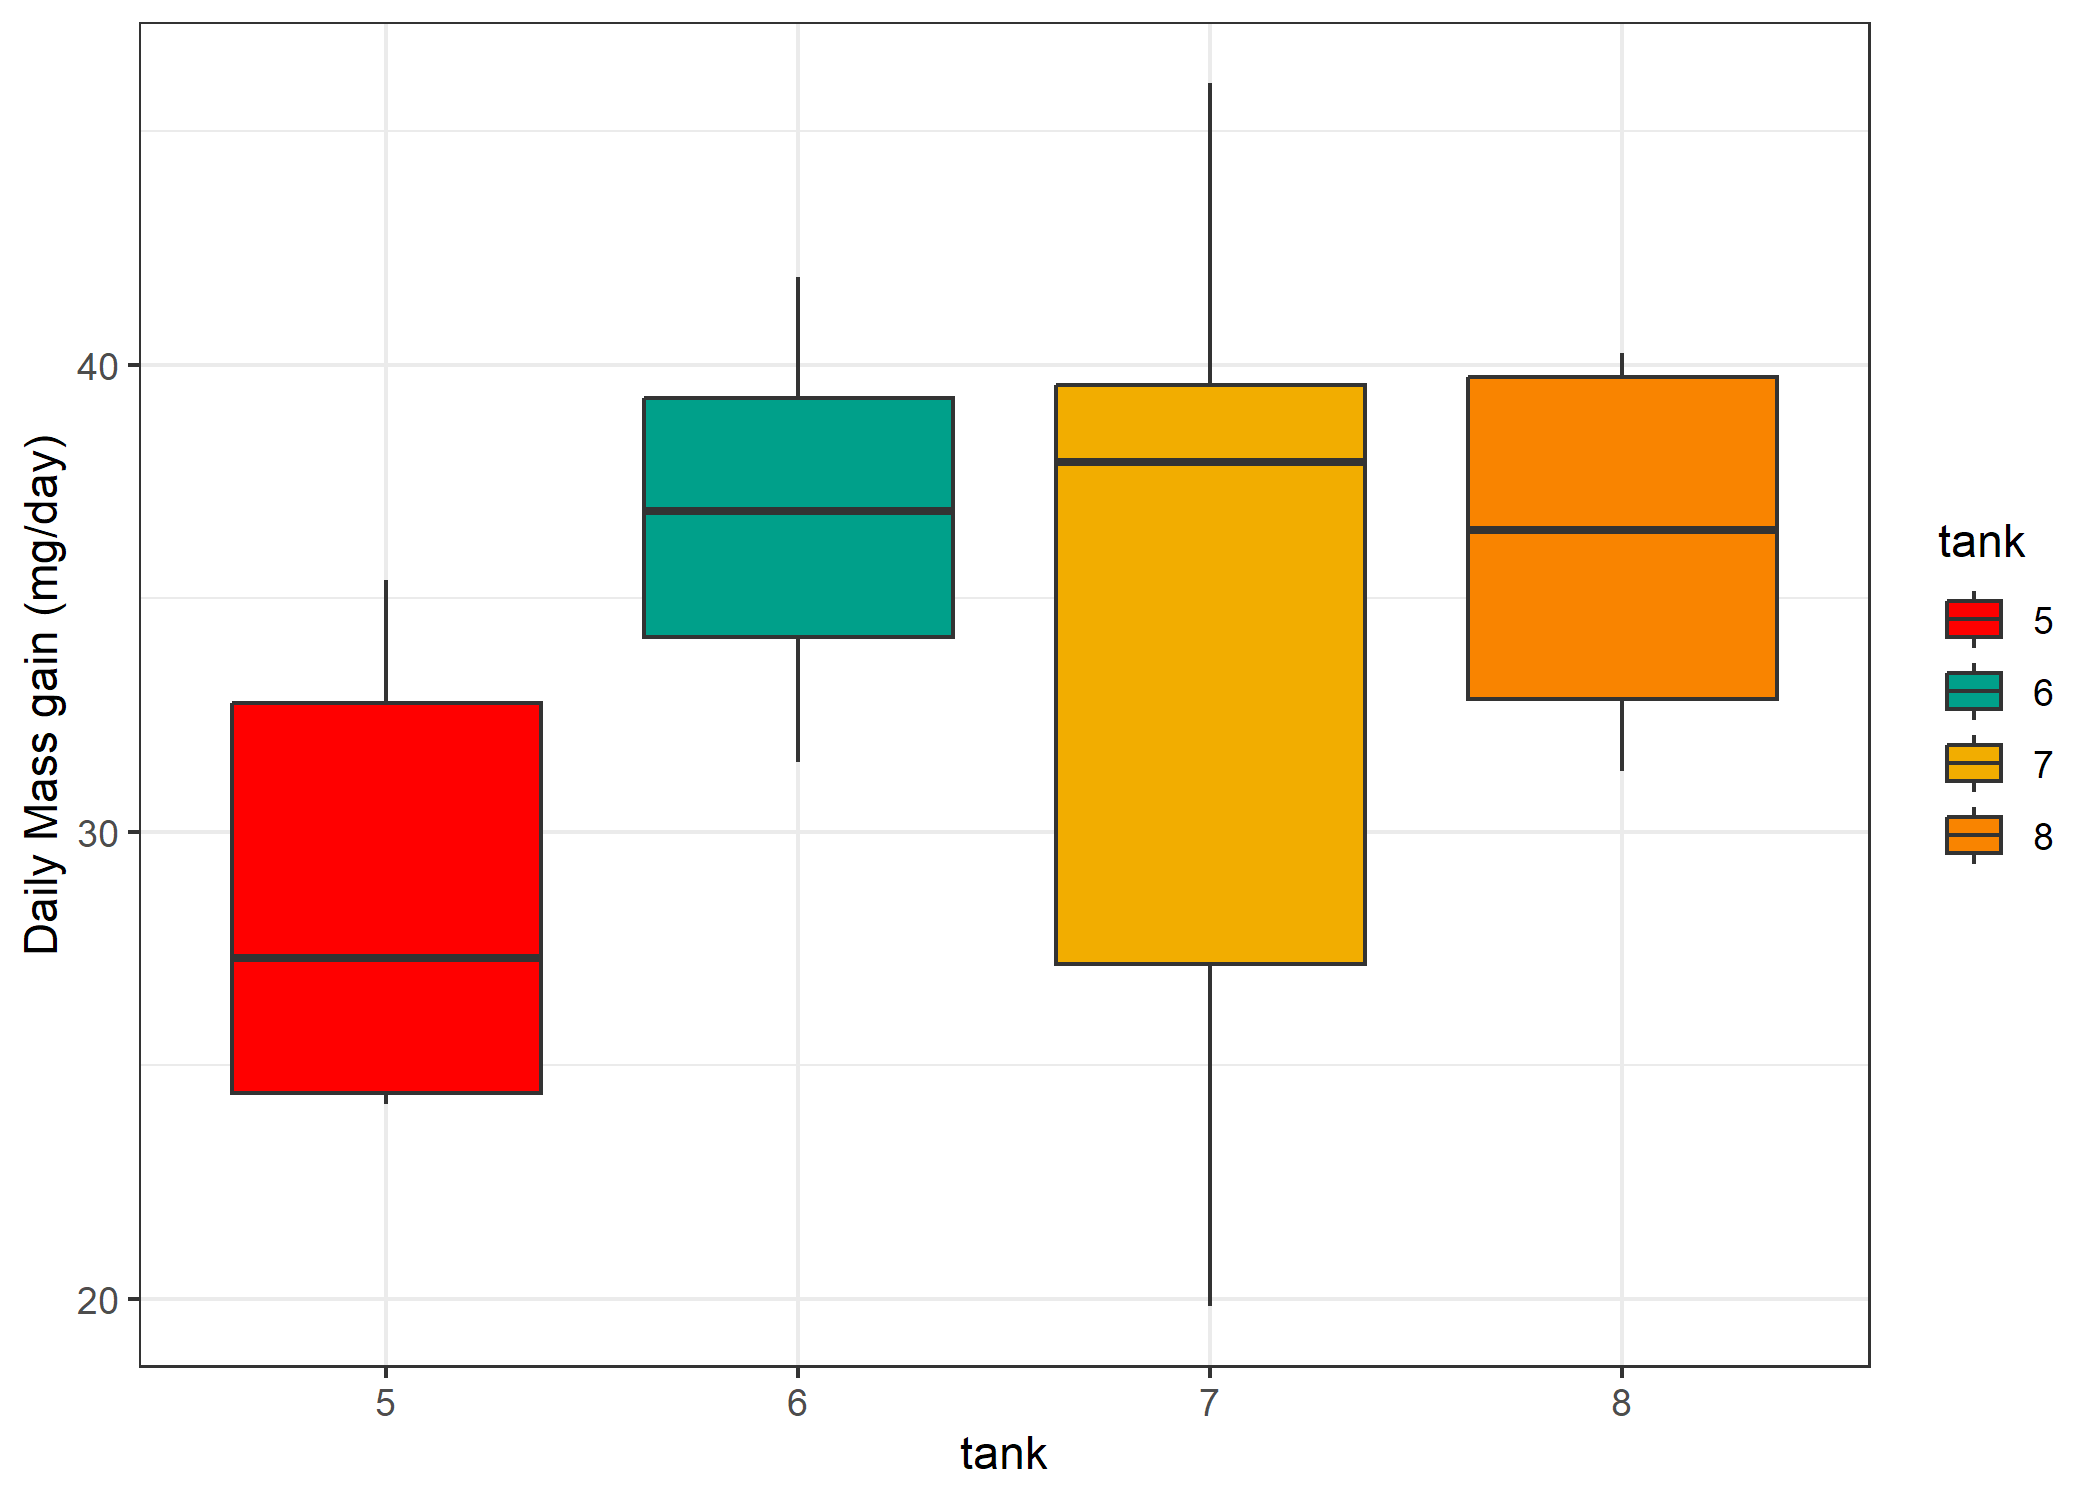
Table 1. Tukey Multiple Comparisons Output
| term | contrast | null.value | estimate | conf.low | conf.high | adj.p.value |
|---|---|---|---|---|---|---|
| tank | 6-5 | 0 | 8.044183 | -2.102672 | 18.191037 | 0.1531608 |
| tank | 7-5 | 0 | 6.184415 | -3.078353 | 15.447184 | 0.2743877 |
| tank | 8-5 | 0 | 7.413559 | -3.930969 | 18.758087 | 0.2915231 |
| tank | 7-6 | 0 | -1.859767 | -11.122536 | 7.403001 | 0.9428549 |
| tank | 8-6 | 0 | -0.630624 | -11.975152 | 10.713904 | 0.9986310 |
| tank | 8-7 | 0 | 1.229143 | -9.332038 | 11.790324 | 0.9878626 |
On the cathodes, we experienced a problem I term “electro-pop”. This is when the calcium carbonate precipitate, growing at the interface of the cathode and water, pushed off the coral or glue from the cathode. When this happened, I scraped off some of the precipitate, rescored the top of the cathode, and reglued the coral. The mass is thus altered not only by coral growth and abiotic mineral accretion, but also by the removal of old precipitate and the addition of new glue. I labeled these mass changes as “reglued” and filtered them from the analysis.
Additionally, towards the end of this growth period the precipitate grew so much that it was blocking electrical contact between the ring terminal and the bottom of the cathode. It was visible when this occurred since there was no longer production of hydrogen gas bubbles. I fixed this by removing a small amount of abiotic precipitate and cleaning the ring terminals. This small removal was approximately even for all MAT controls and corals. While this small removal will result in a slight decreased growth rate, these decrease should be even for both MAT controls and corals and therefore should not impact the conclusions. I labeled these dates as “no electric” and filtered them from the analysis.
The average daily abiotic growth rate of the steel cathodes was 34.047 mg/day, 95% CI [31.287, 36.808]. There is no significant difference in the growth rates of these MAT controls when performing a Tukey multiple comparisons of means ($\alpha = 0.05$). These abiotic growth rates need to be taken into account when looking at the growth rates of the MAT corals since this abiotic growth is on average 27.345 mg more or 408% more than just the growth of the corals on the inert acrylic plugs.
I did not present a mass-standardized growth rate here because the relationship is identical to the daily mass gain graph (Figure 6).
MAT Corals
We will first look at the total MAT growth and then subtract out this average MAT growth per tank for the corals to see how they perform against the combination of the bare cathode and acrylic controls. This is the basis of our investigation: do corals grown with MAT grow faster than controls after accounting for the abiotic precipitate.
How did the MAT corals grow?
Figure 7. All MAT Corals by Tank and Date
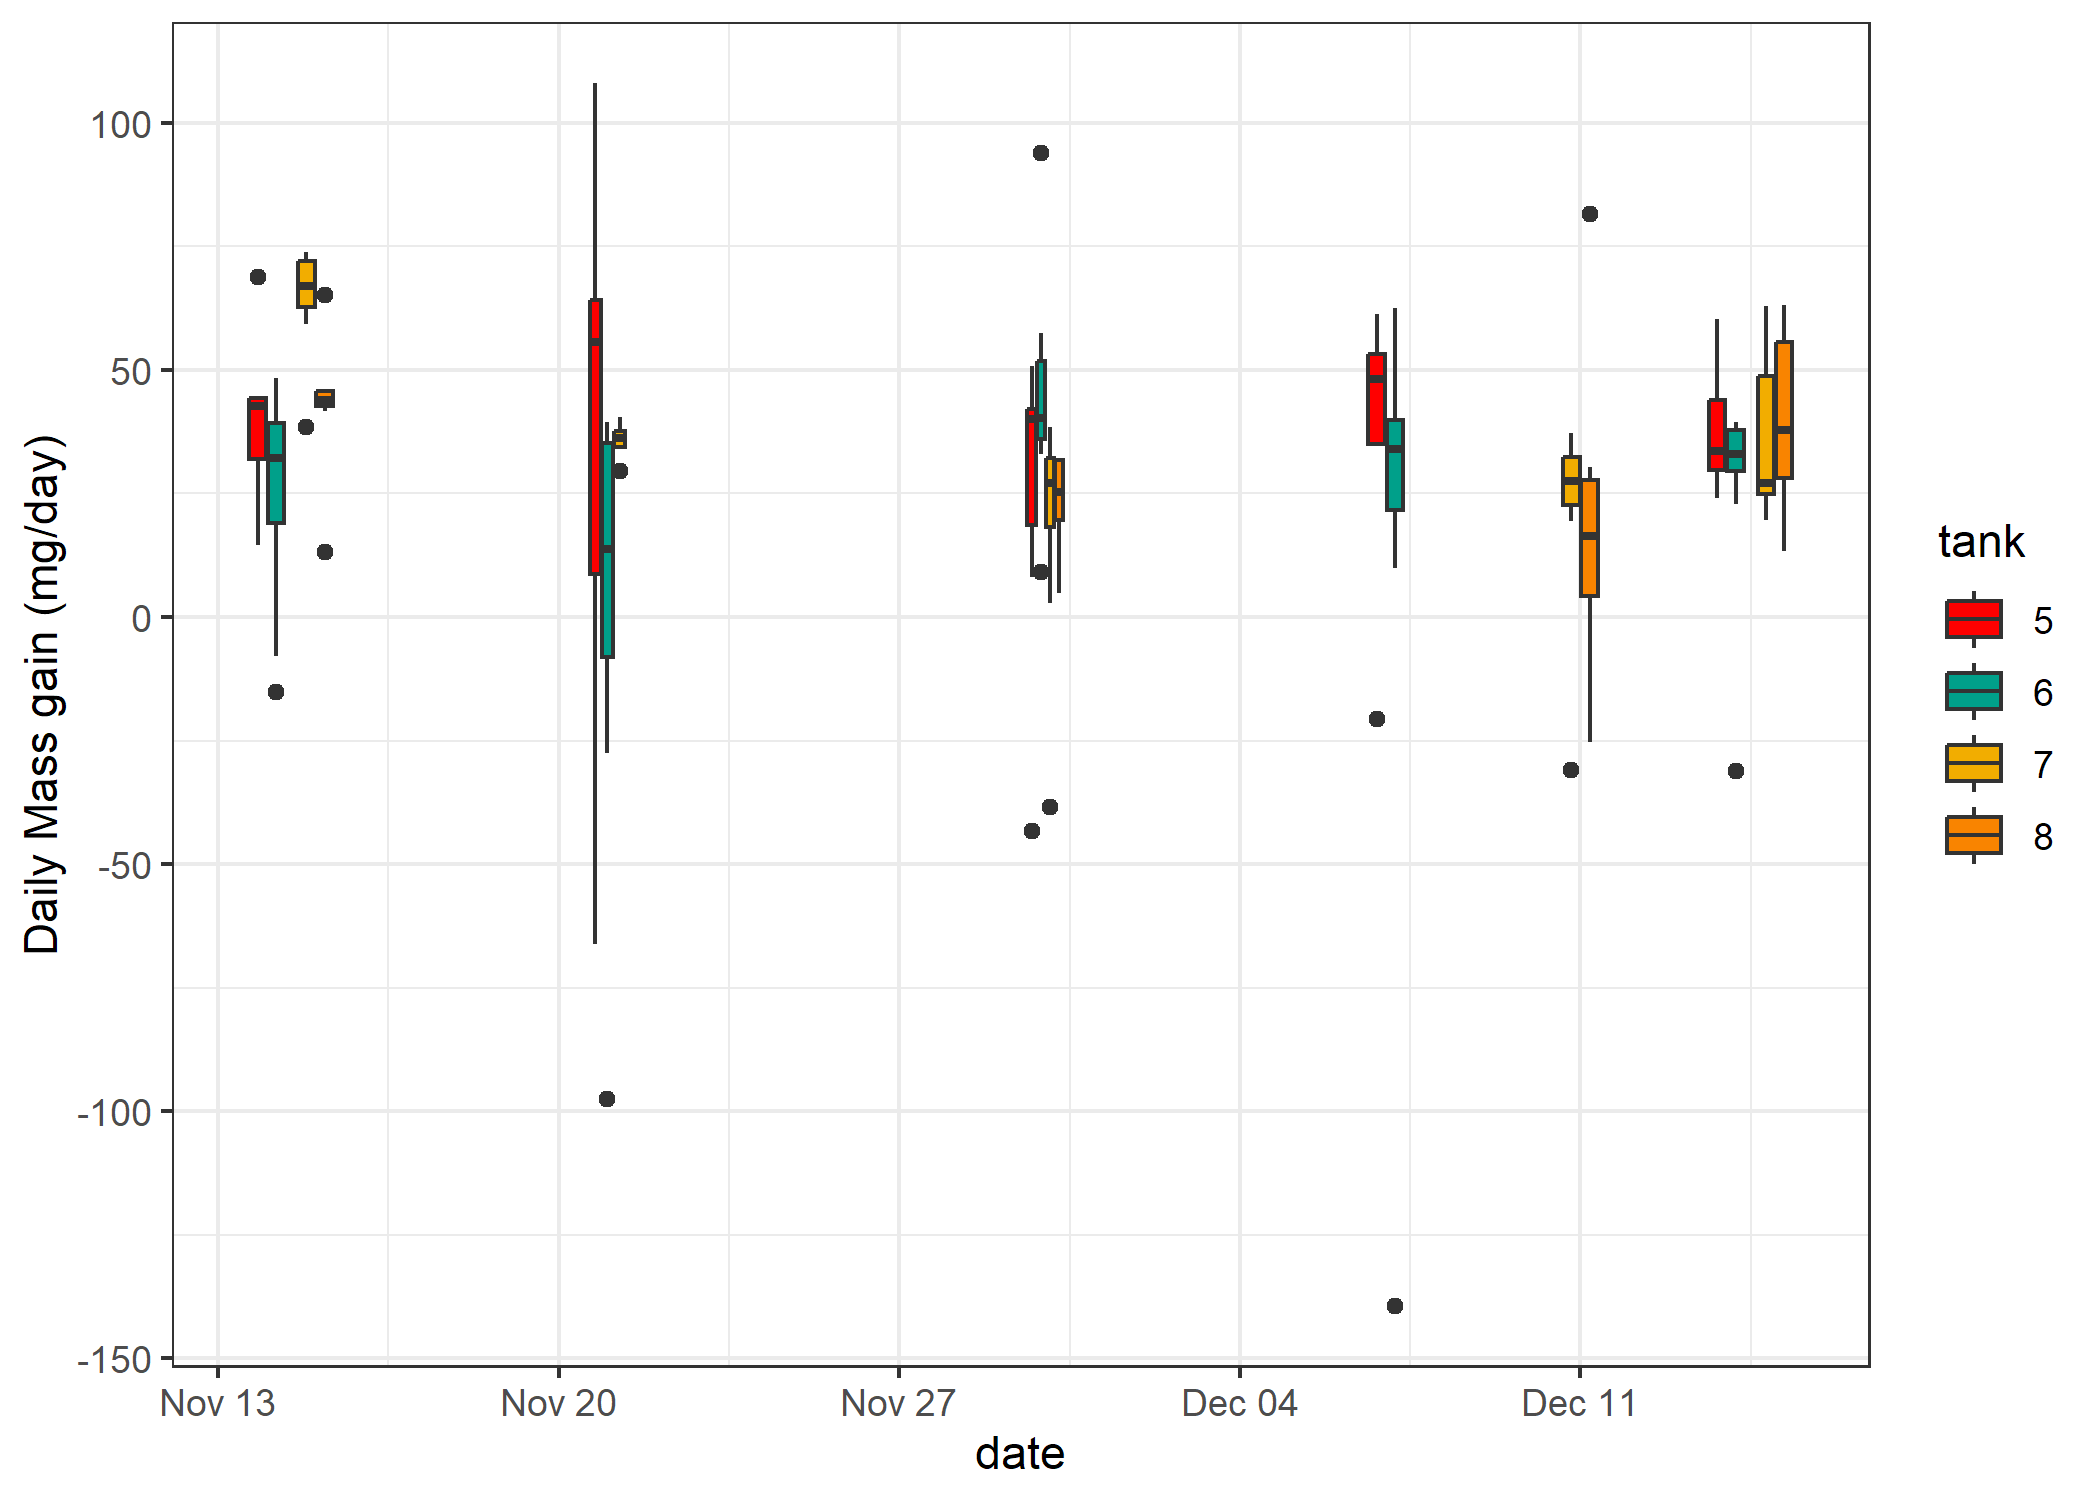
Figure 8. Filtered MAT Corals by Tank and Date
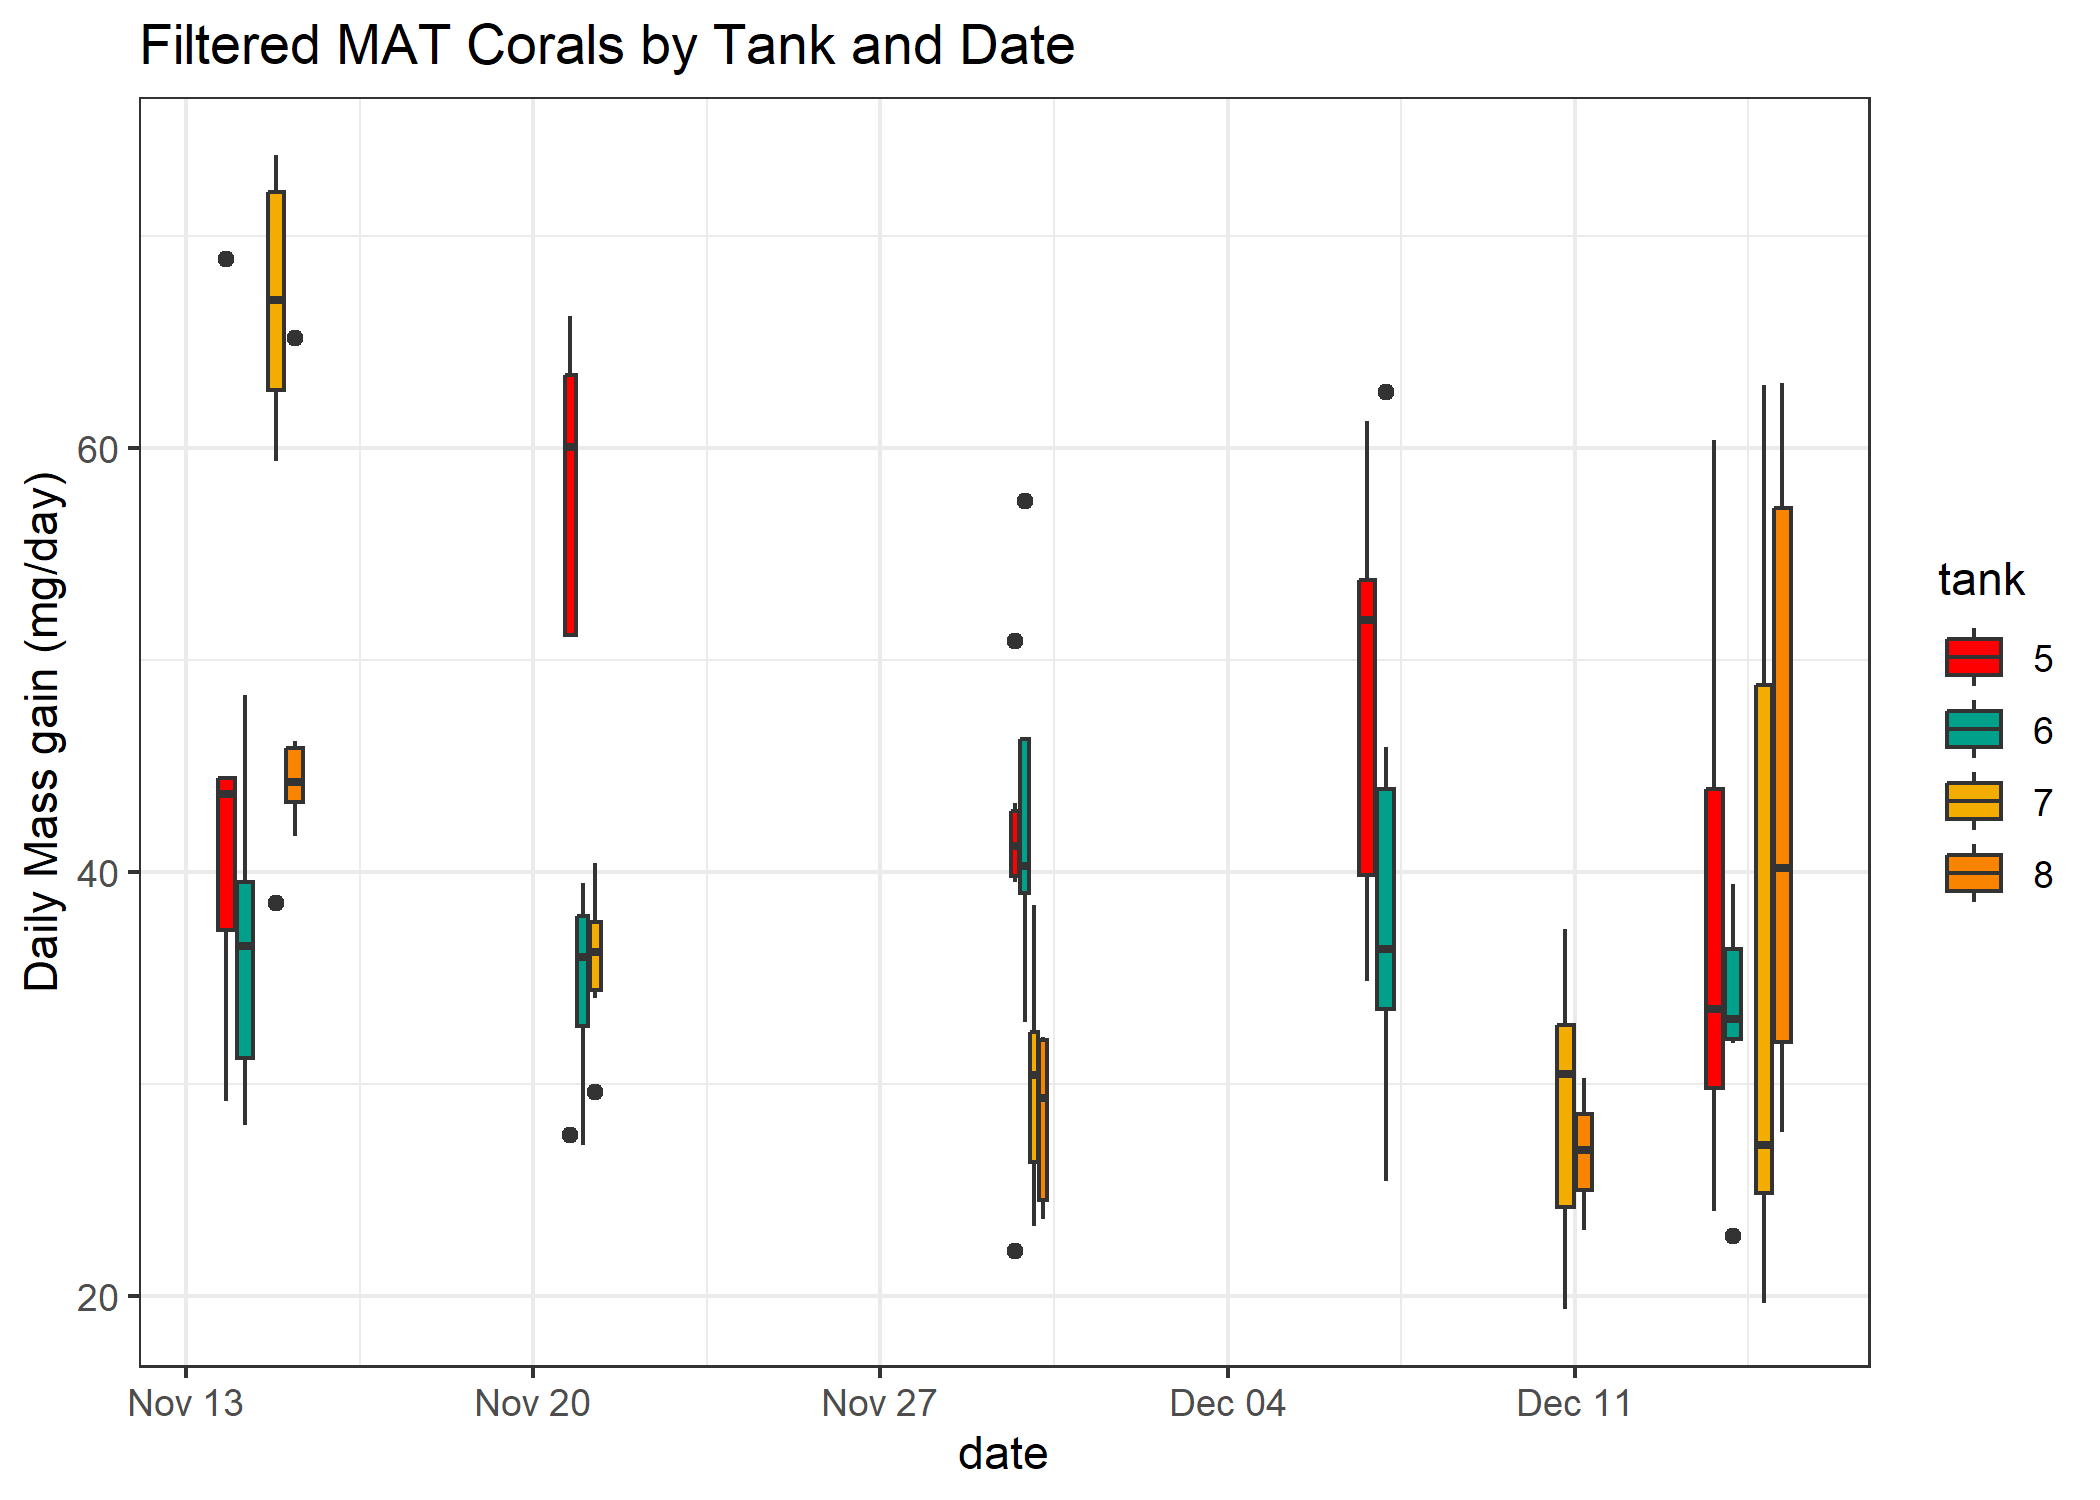
Figure 9. Filterd MAT Corals by Tank
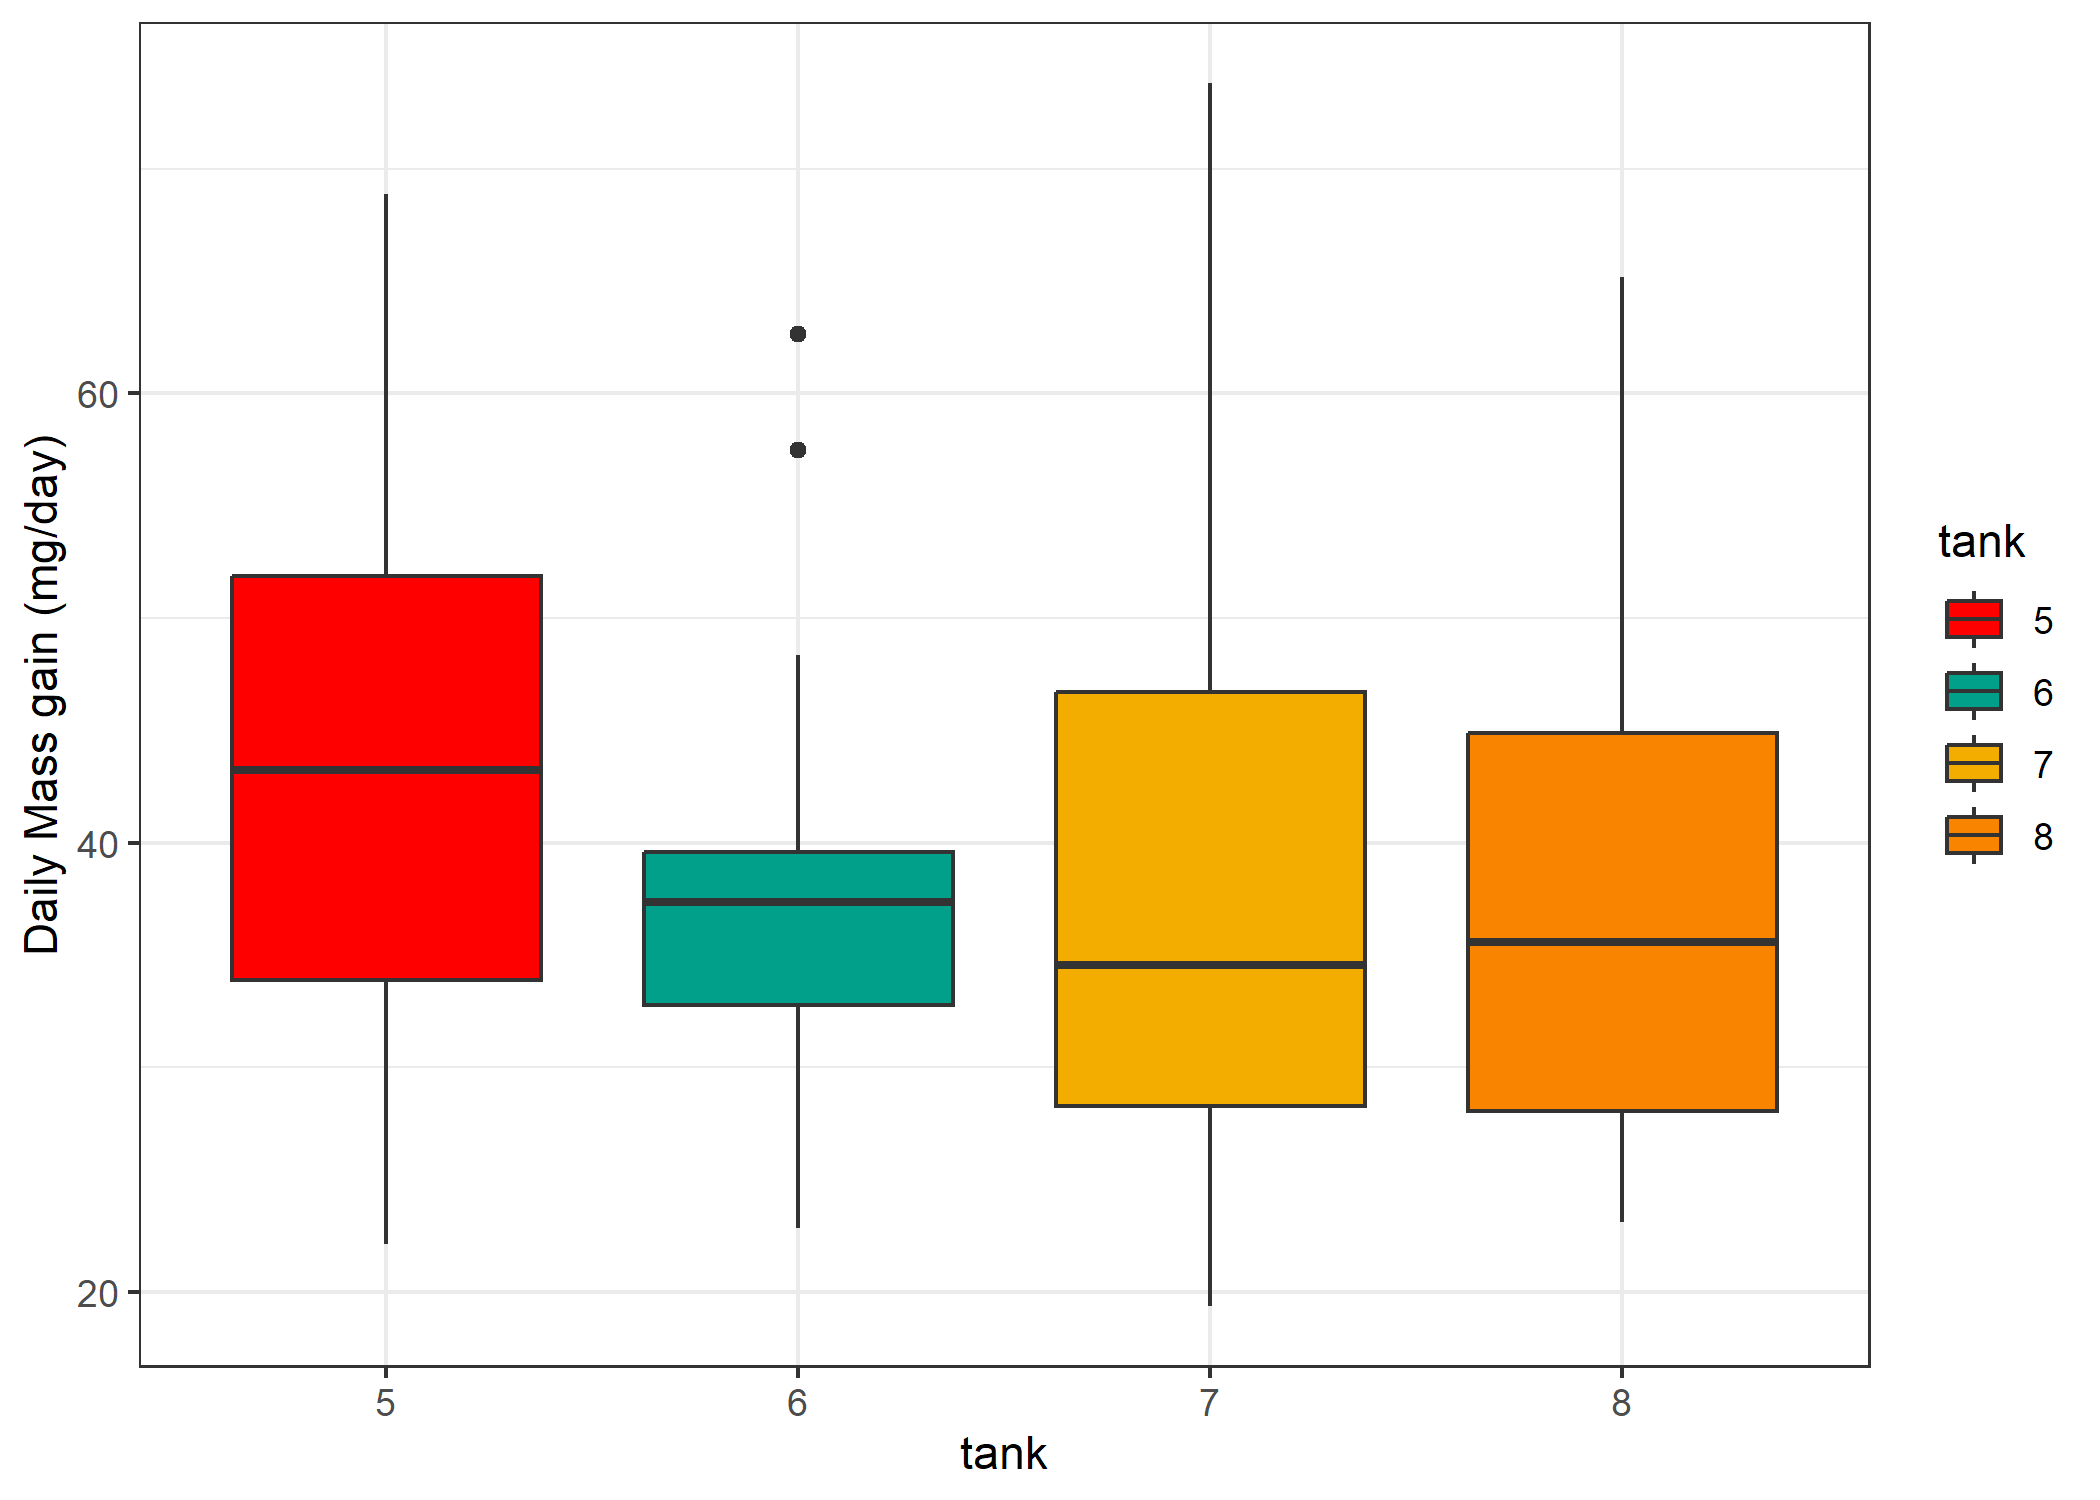
Figure 10. Filtered MAT Corals’ Standardized Daily Growth Rate by Tank
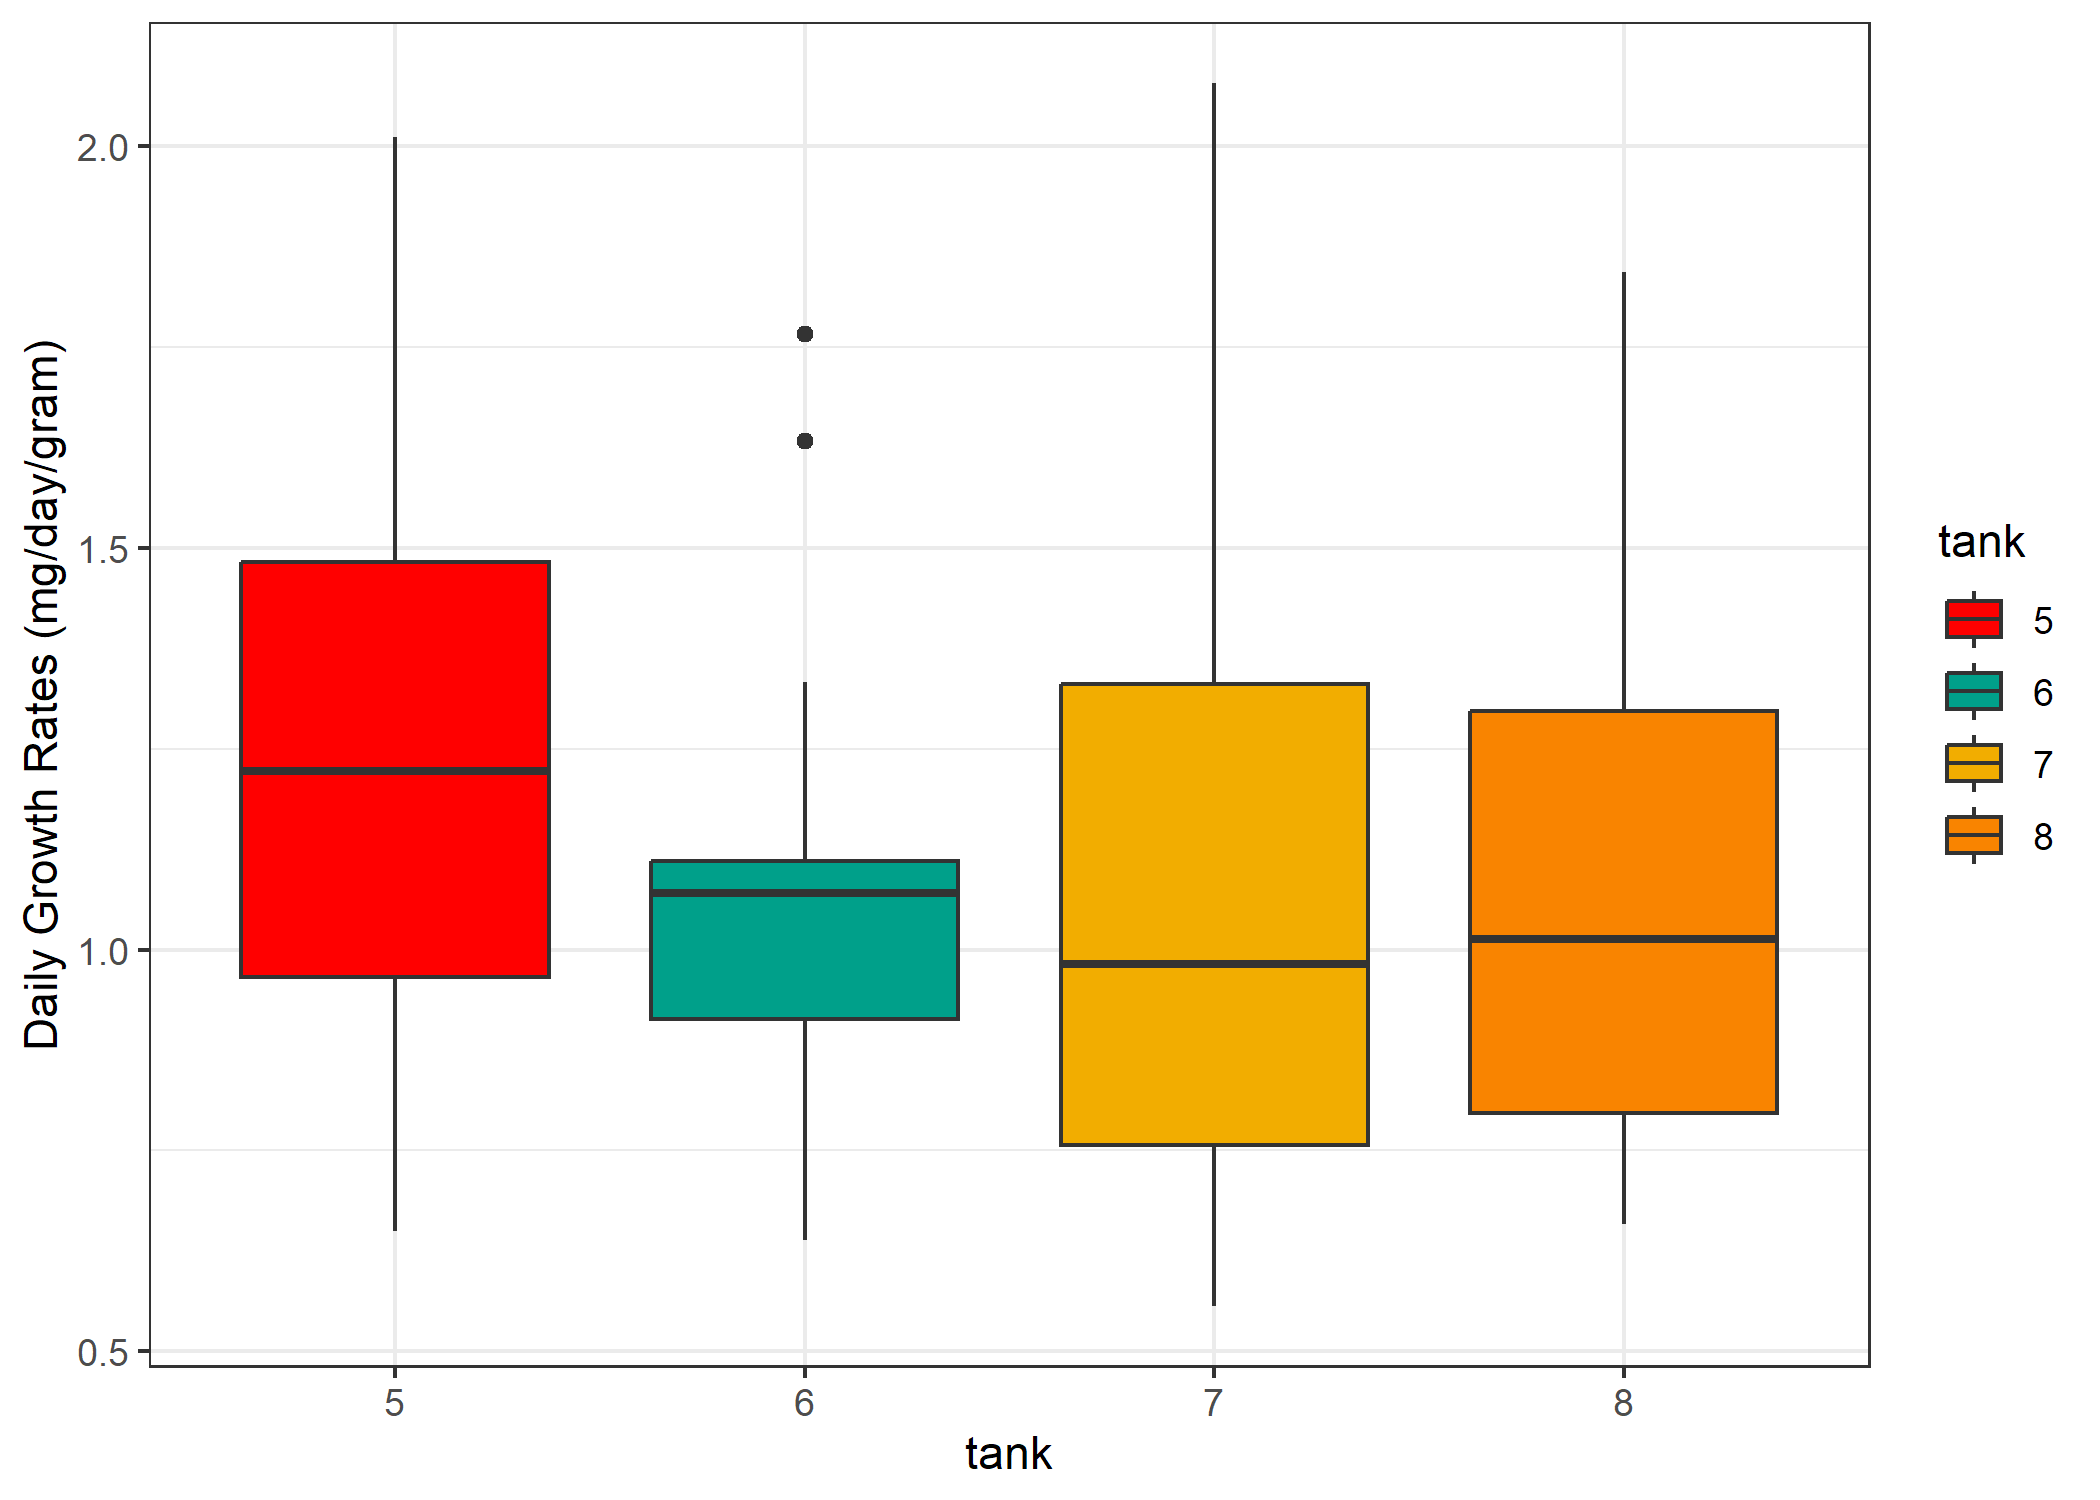
Table 2. Tukey Multiple Groups Comparisons
| term | contrast | null.value | estimate | conf.low | conf.high | adj.p.value |
|---|---|---|---|---|---|---|
| tank | 6-5 | 0 | -6.364825 | -15.370687 | 2.641038 | 0.2590354 |
| tank | 7-5 | 0 | -4.113326 | -12.422919 | 4.196266 | 0.5709286 |
| tank | 8-5 | 0 | -5.159968 | -14.586711 | 4.266775 | 0.4853003 |
| tank | 7-6 | 0 | 2.251498 | -6.532572 | 11.035568 | 0.9088833 |
| tank | 8-6 | 0 | 1.204856 | -8.642684 | 11.052396 | 0.9887213 |
| tank | 8-7 | 0 | -1.046642 | -10.261728 | 8.168444 | 0.9909288 |
The average daily increase in mass of the MAT corals was 40.133 mg/day, 95% CI [37.717, 42.549].
The average initial-mass standardized daily growth rate was 1.14 mg/day/ initial g, 95% CI [1.071, 1.21].
Subtracting MAT controls from the MAT Corals
We can combine the means and confidence intervals for all the corals thus far to get a rough comparison to the MAT corals. I’m labeling this row “combined controls” below. There’s likely a more statistically robust way to compare the MAT to the combination of MAT controls + acrylic controls, but for now I’ll just present this straight forward way.
Table 3. Comparing group means and CI. Combined controls is the sum of the bare MAT cathodes and the acrylic control corals, which is an apt comparison to the MAT corals.
| substrate | type | mean | lowerCI | upperCI |
|---|---|---|---|---|
| acrylic | control | 6.701651 | 5.963499 | 7.439803 |
| MAT | control | 34.047149 | 31.286521 | 36.807777 |
| combined controls | control | 40.748800 | 37.250020 | 44.247580 |
| MAT | experiment | 40.132686 | 37.716597 | 42.548774 |
Takeaways
- The average growth rate of the MAT corals is indistinguishable from the combination of MAT controls + acrylic controls
- The abiotic precipitate grew at a rate of 5.08x the control corals. This is within the range (3-20x) of the increased growth rates proposed by some of the early case studies. Some of the field studies by other authors saw a more moderate 20-50% increase in growth rates as determined by total linear extension. This moderate increase falls in line with increases in growth rates seen on different restoration nursery platforms (e.g., Kuffner et al. 2017; O’Donnell et al. 2017), suggesting that the increases from the moderate field studies may be entirely explained by the growth platform and not by electrolysis.
- From my preliminary abiotic growth rates derived from total alkalinity anomaly incubations, I achieved a spectrum of growth rates which could align with the 3-20x increased growth rates . This could be achieved by increasing the current density greater than what we used in this study (say 3 or 5 $A/m^2$ compared to the 1$A/m^2$ here). However, this would change the precipitated mineral from calcium carbonate to brucite.
- From this initial evidence, MAT does not increase coral growth rates, likely because all increases in carbonate ion concentration are immediately used by the abiotic precipitation occurring at the cathode-seawater interface.
Devil’s Advocate
- The growth tip of A. cervicornis is placed distal to the cathode, potentially out of its sphere of influence. We may not have experienced the growth potential.
- Abiotic growth may not be such a bad thing. If the coral can maintain a veneer of tissue over the abiotic growth, then the skeleton may incorporate this abiotic precipitate.
One way to test both of these ideas is to place these corals horizontally how Ian has suggested before, rather than a normal upright position. I stopped regluing the fallen corals after the weighing session on 12/15 and placed these corals horizontally. My expectation is that the coral will die and be overgrown by the precipitate, negating both the points raised above. We shall see.
Other evidence
I need to go through the carbonate chemistry data and then relook at the pH microprofiles and the abiotic incubations I did.