Incorporating Seasonality into ERL
research 26 Jul 2022Overview
The Experimental Reef Lab at the University of Miami uses Ecotech Marine’s Radion XR30 Pro lights to illuminate our experimental aquariums. Here I will outline our capabilities to mimic natural light regimes in our aquaria including seasonal variation and moonlight.
We can incorporate seasonal changes of light exposure with daily changes in exposure duration and intensity. Further, we can add simulated moonlight into our system, fully equipped with changing moonrise and moonset times and lunar phases.
Light Performance
The standard setup we have places the light 50cm above the bottom of the aquarium. This results in the following light curve based on full spectrum set to 100% and the point intensity varying from 0-100%. As Morgan has shown, we can lower the light closer to the water to reach PAR levels exceeding 800 micromol m^-2 s^-1 .
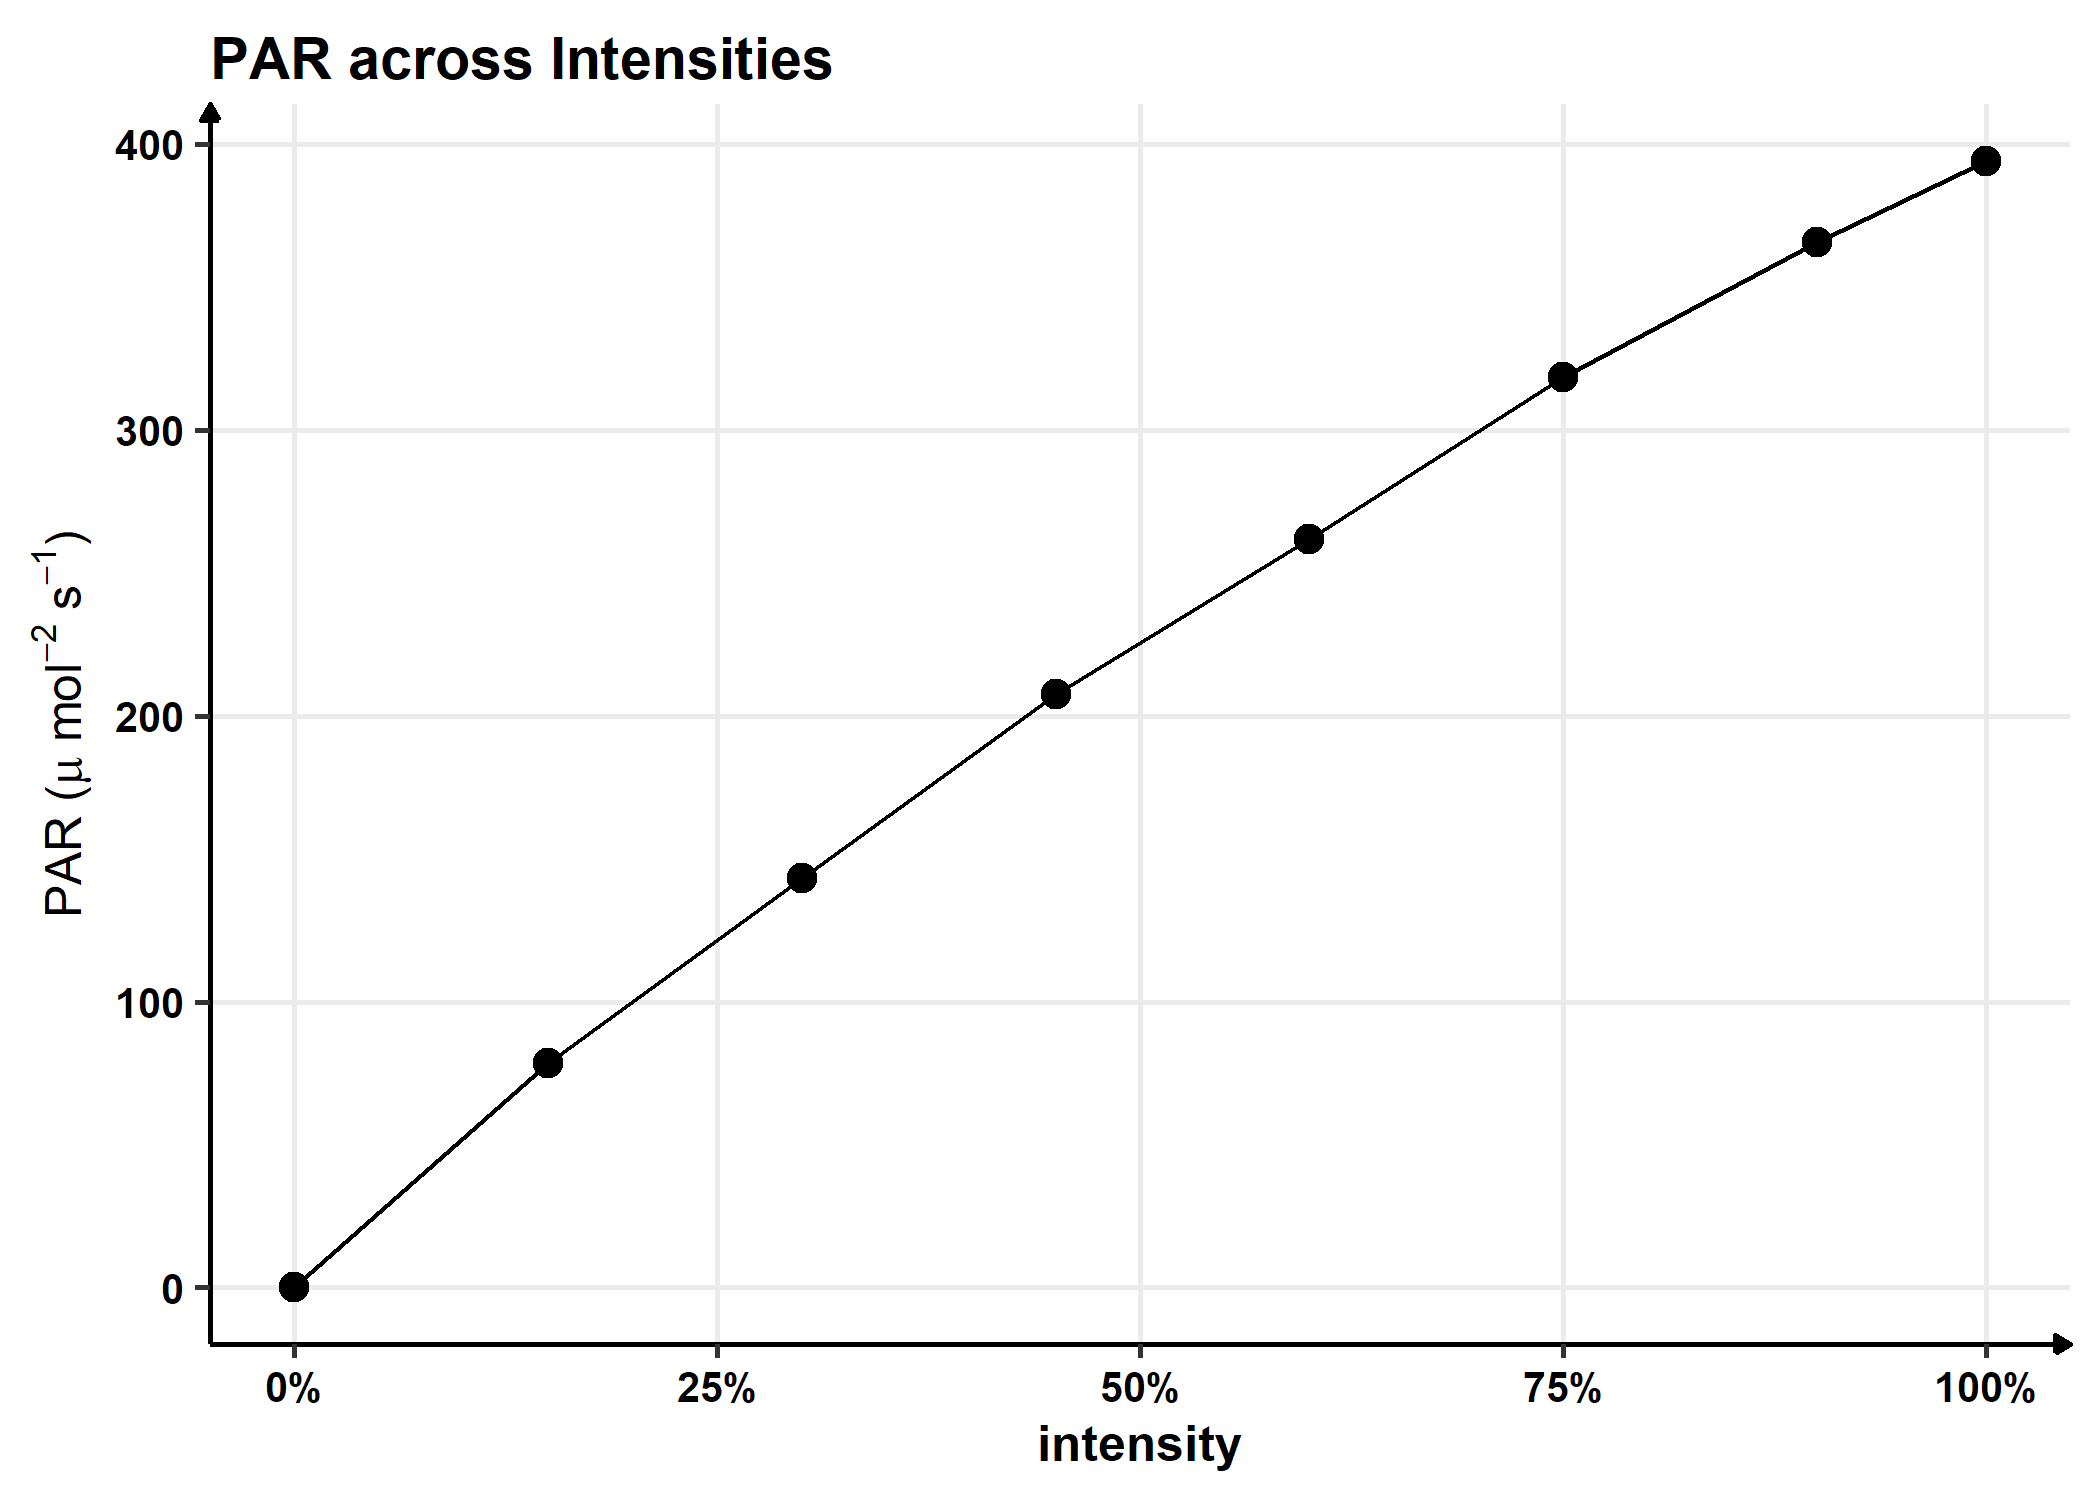
- Note - All values were converted to our lab standard by dividing Apogee readings by 1.2 to be equal to values we see from Seabird EcoPAR.
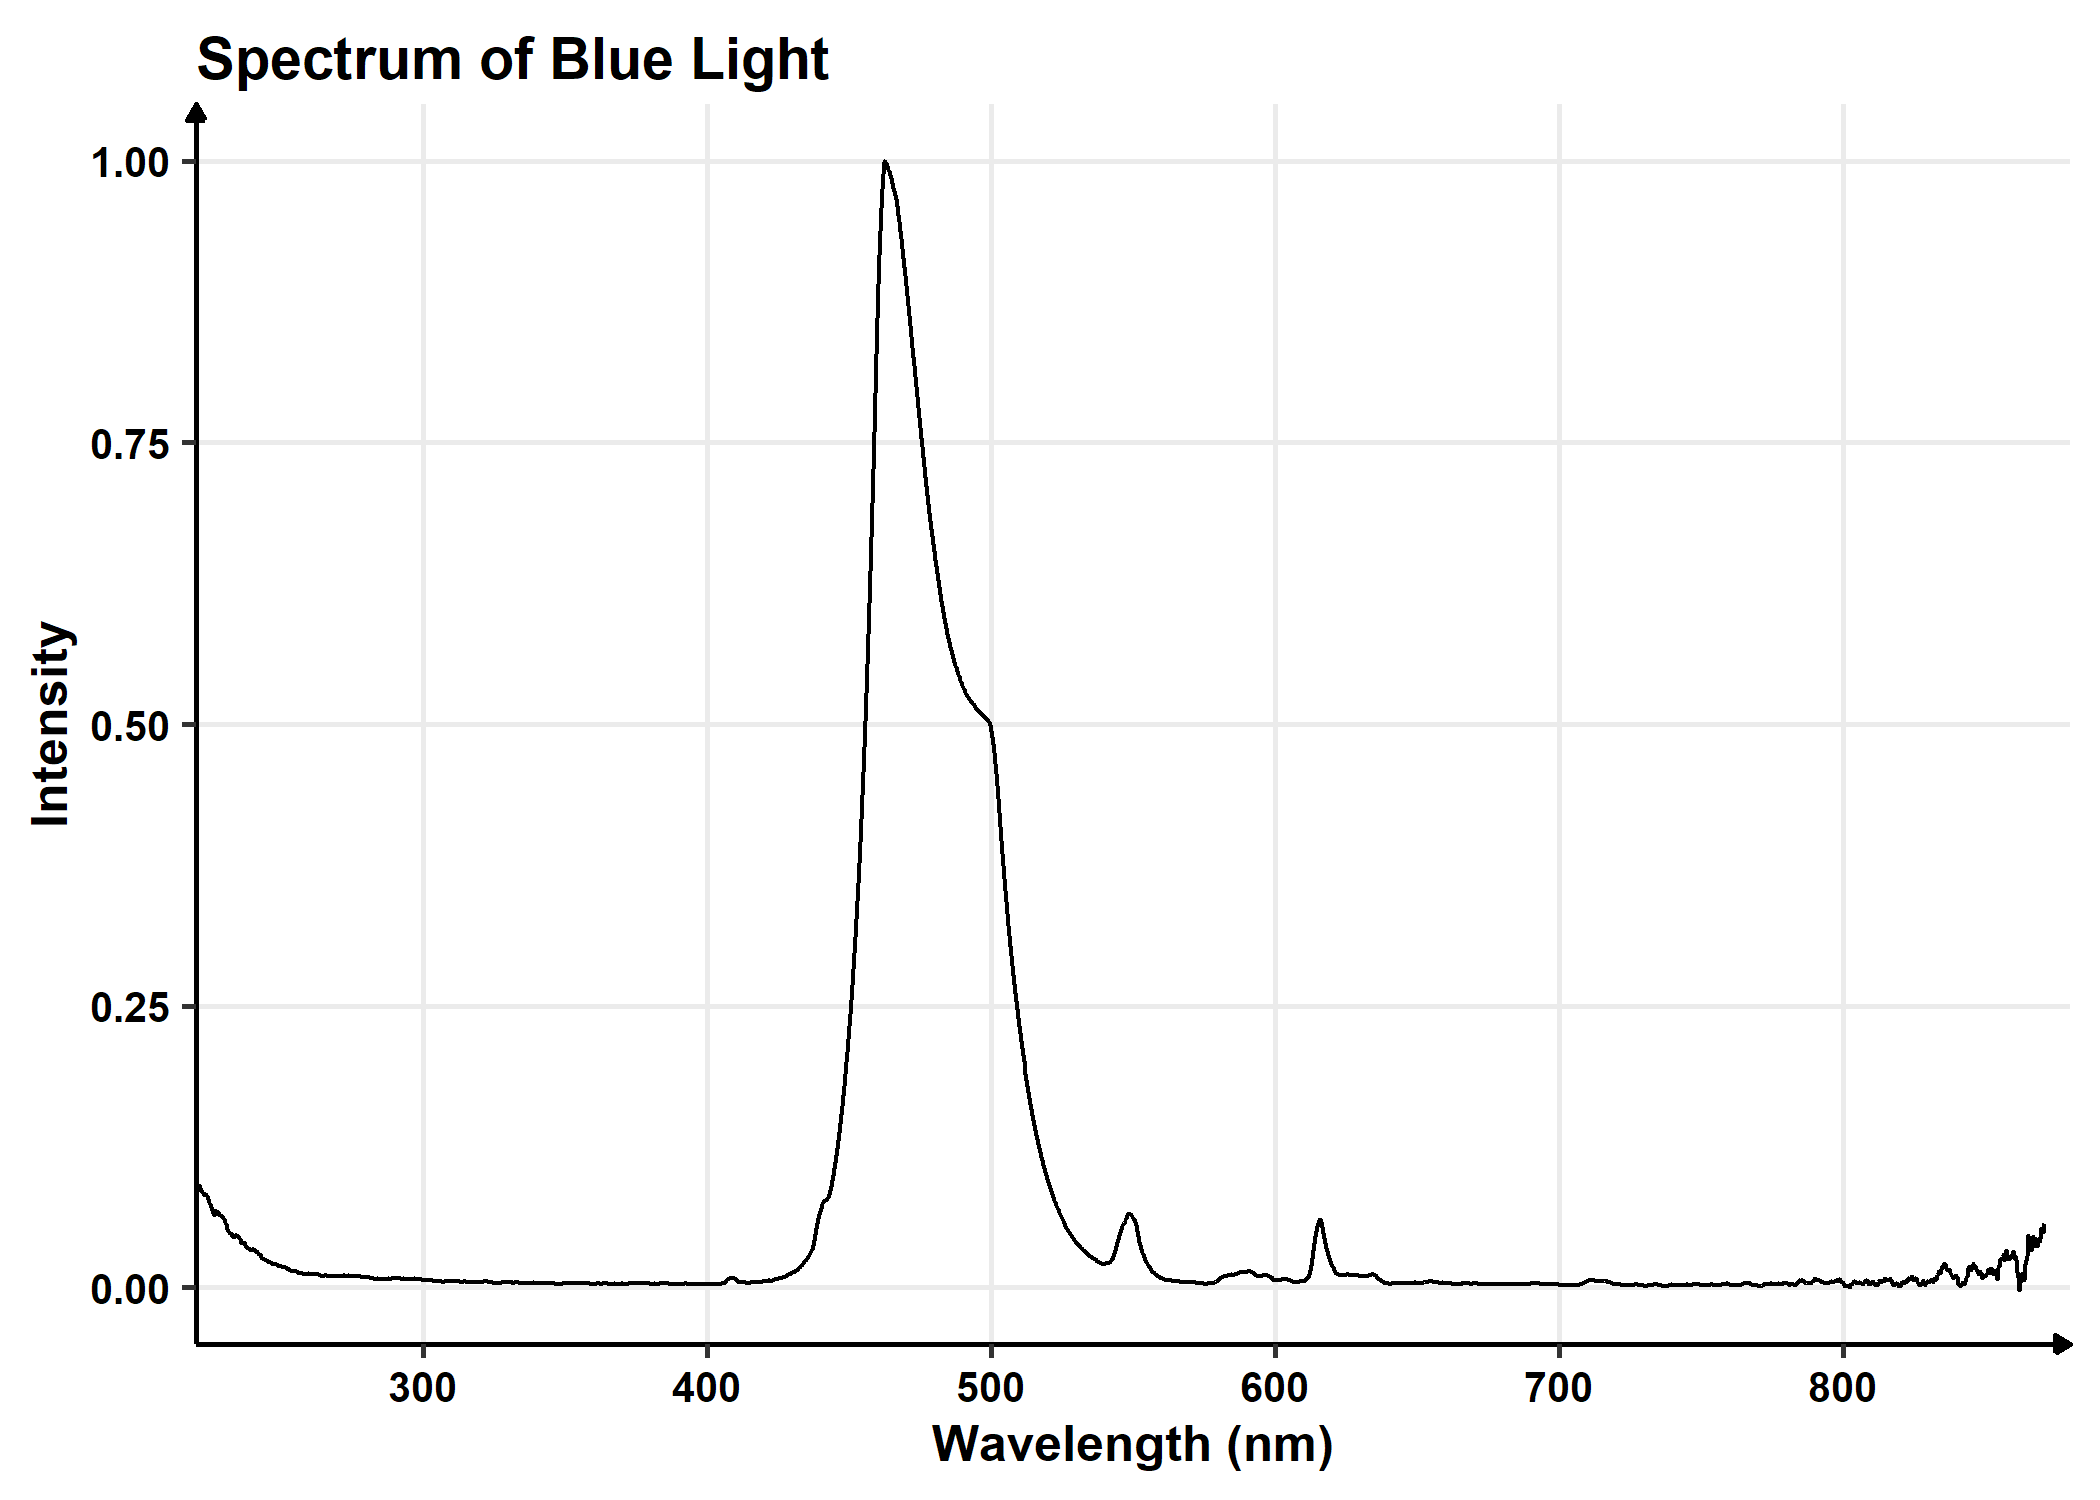
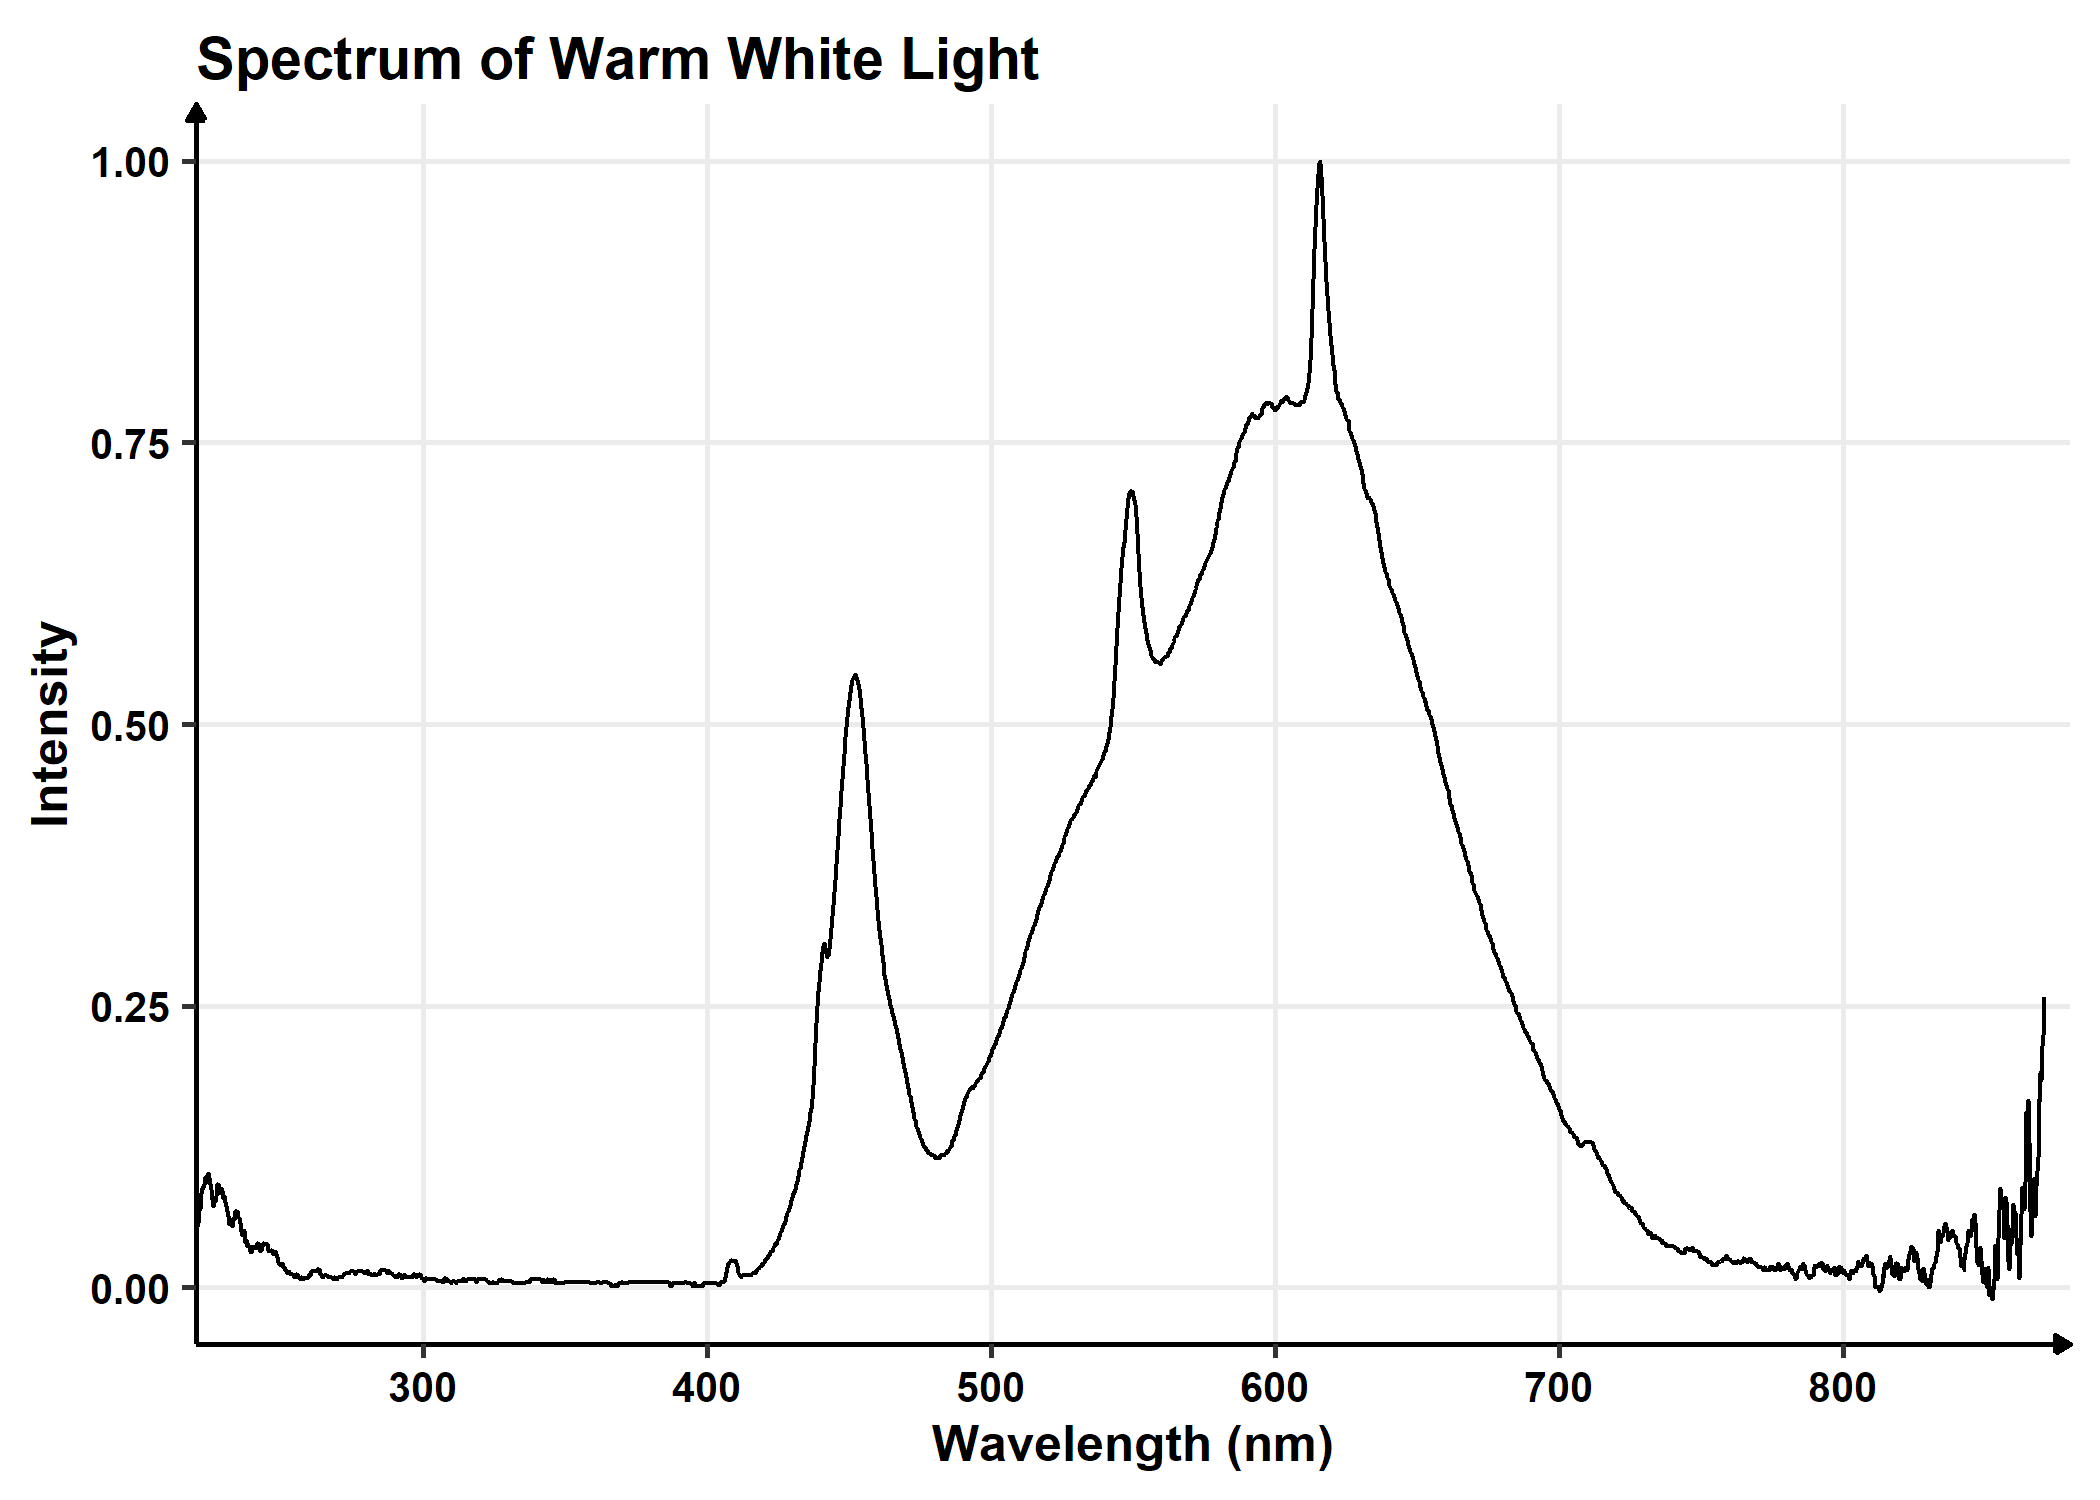
Light Spectra
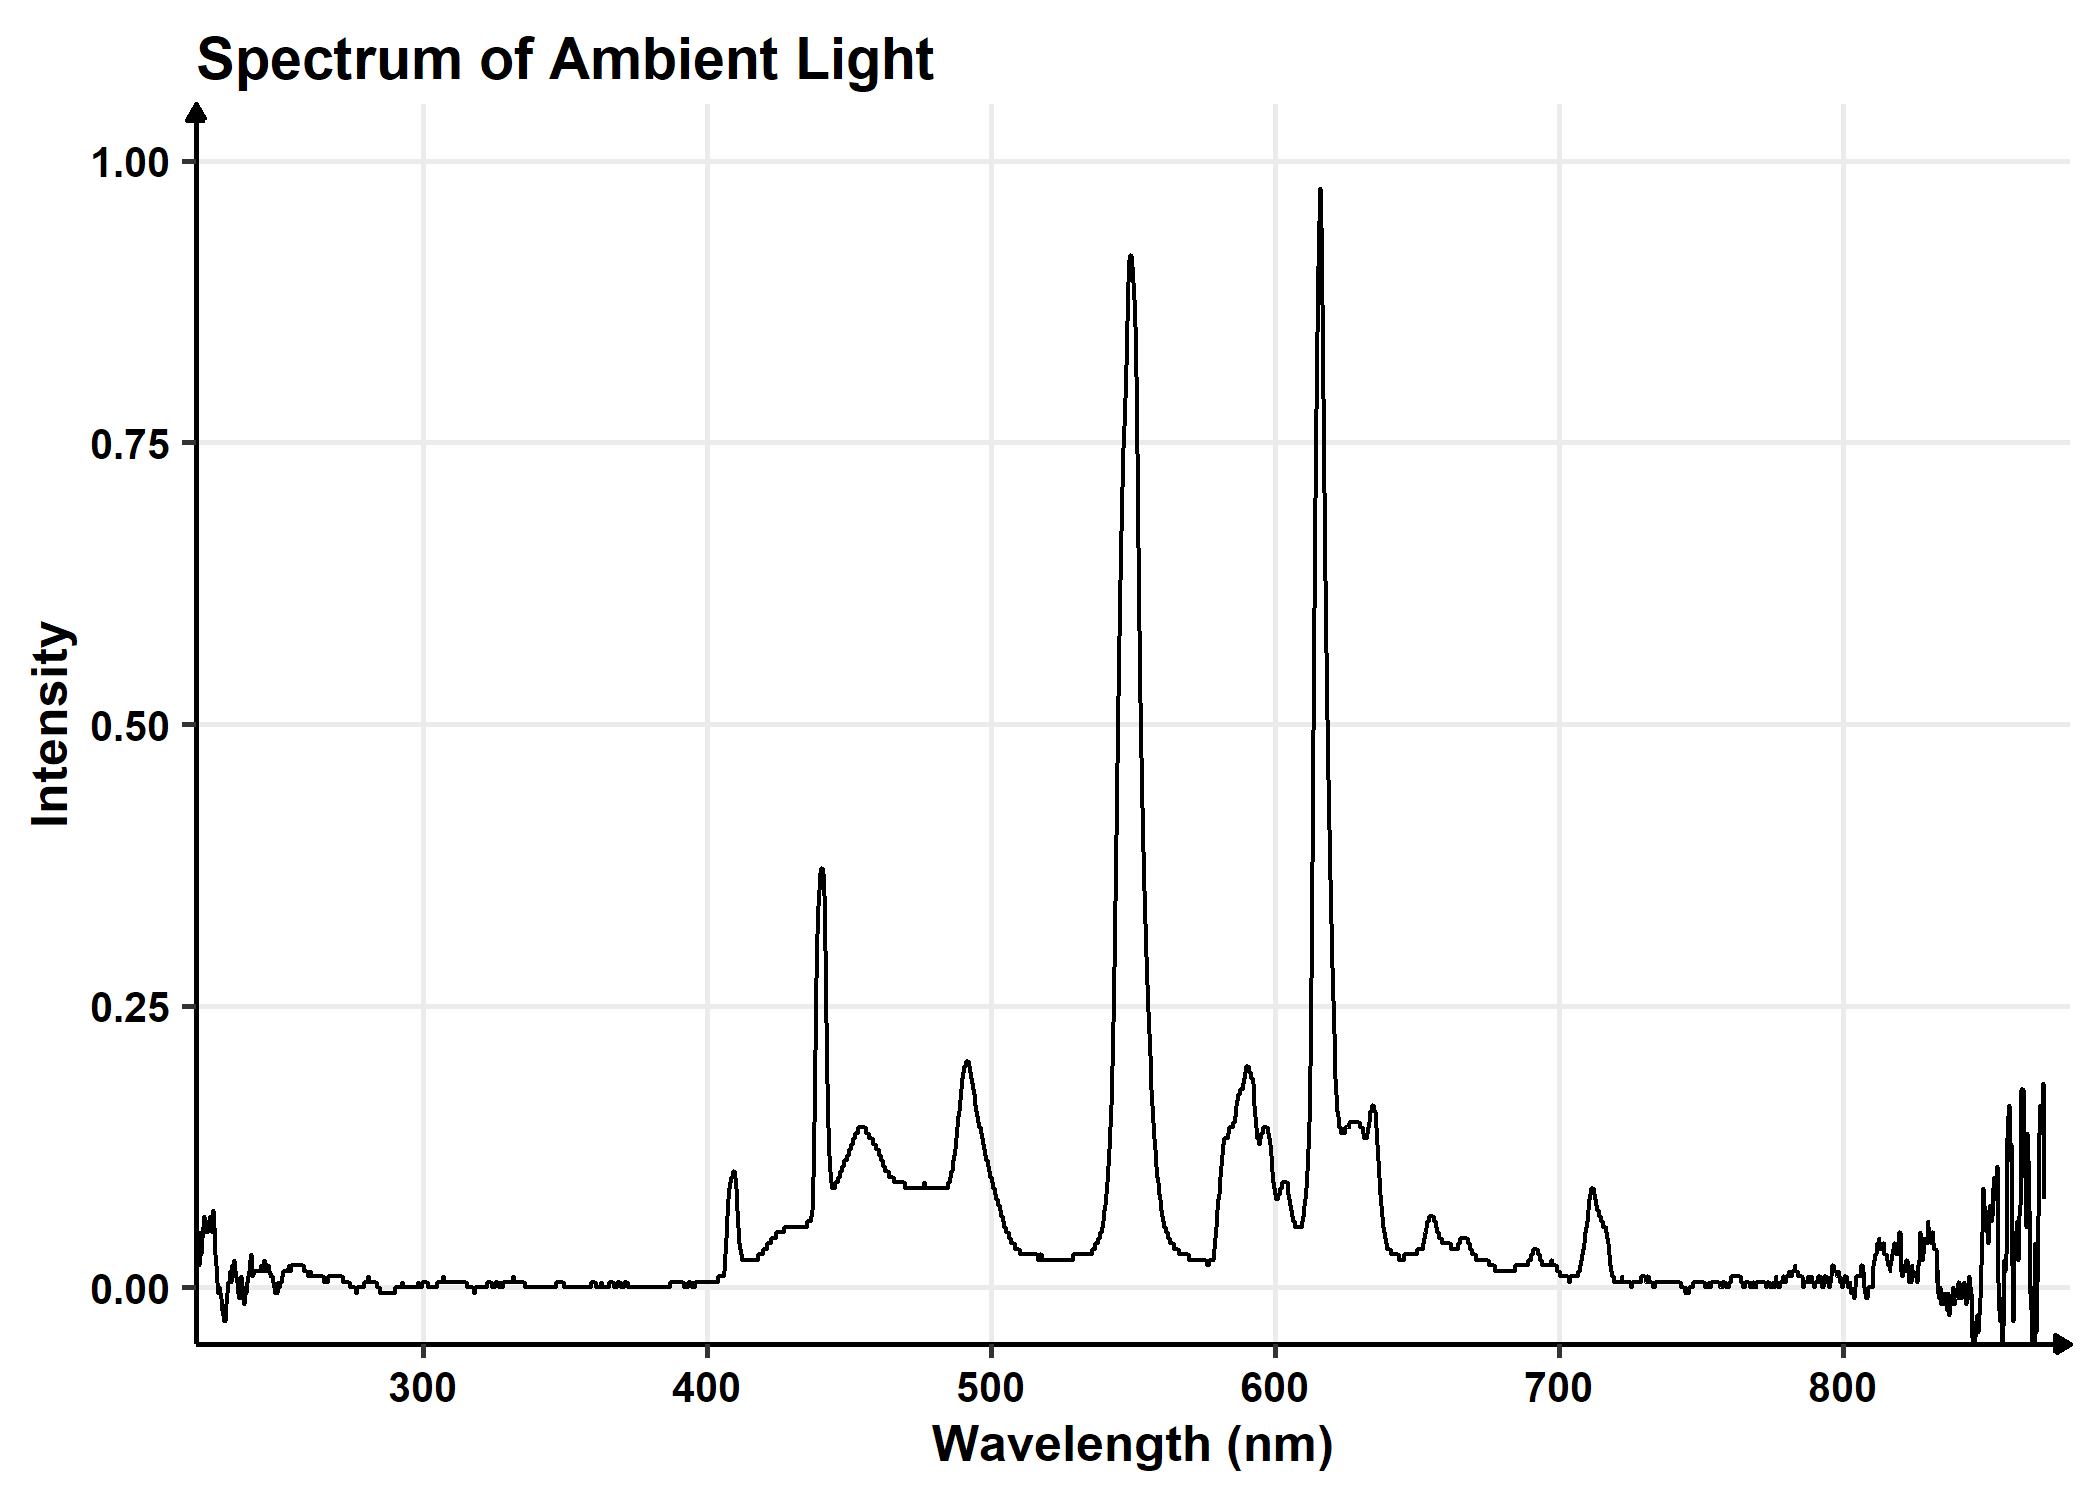
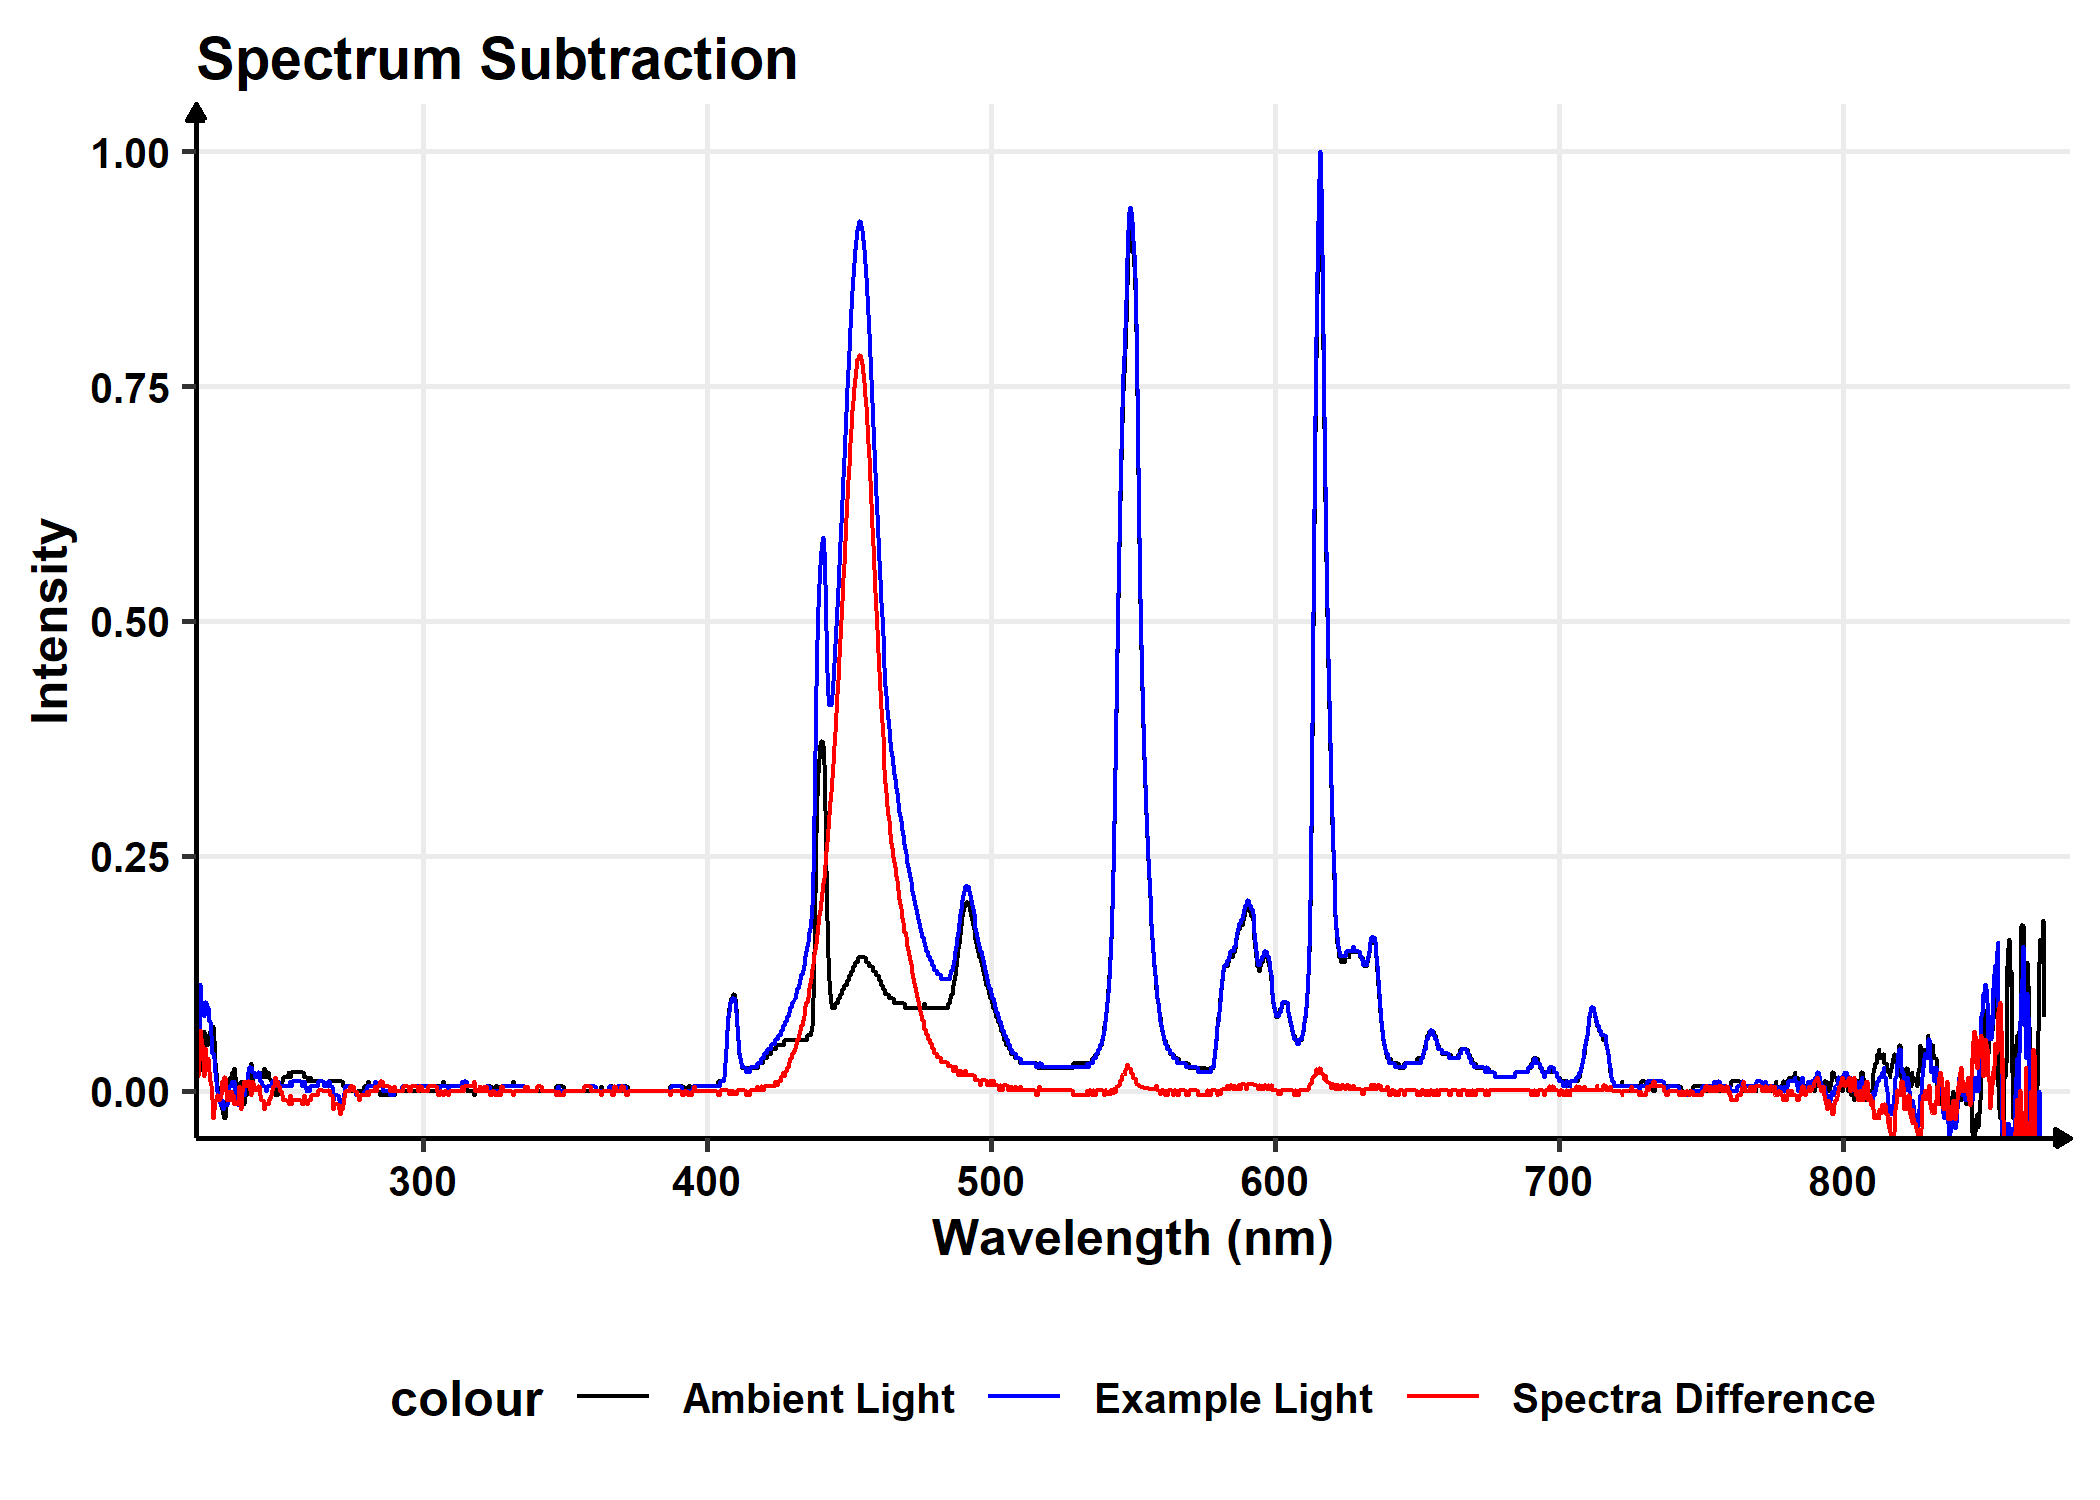
I collected a light spectrum for each setting in the Mobius app. I also captured a spectrum with the light off to create an ambient spectrum that I will subtract from all other spectra. Below is an example of the subtraction.
Spectra
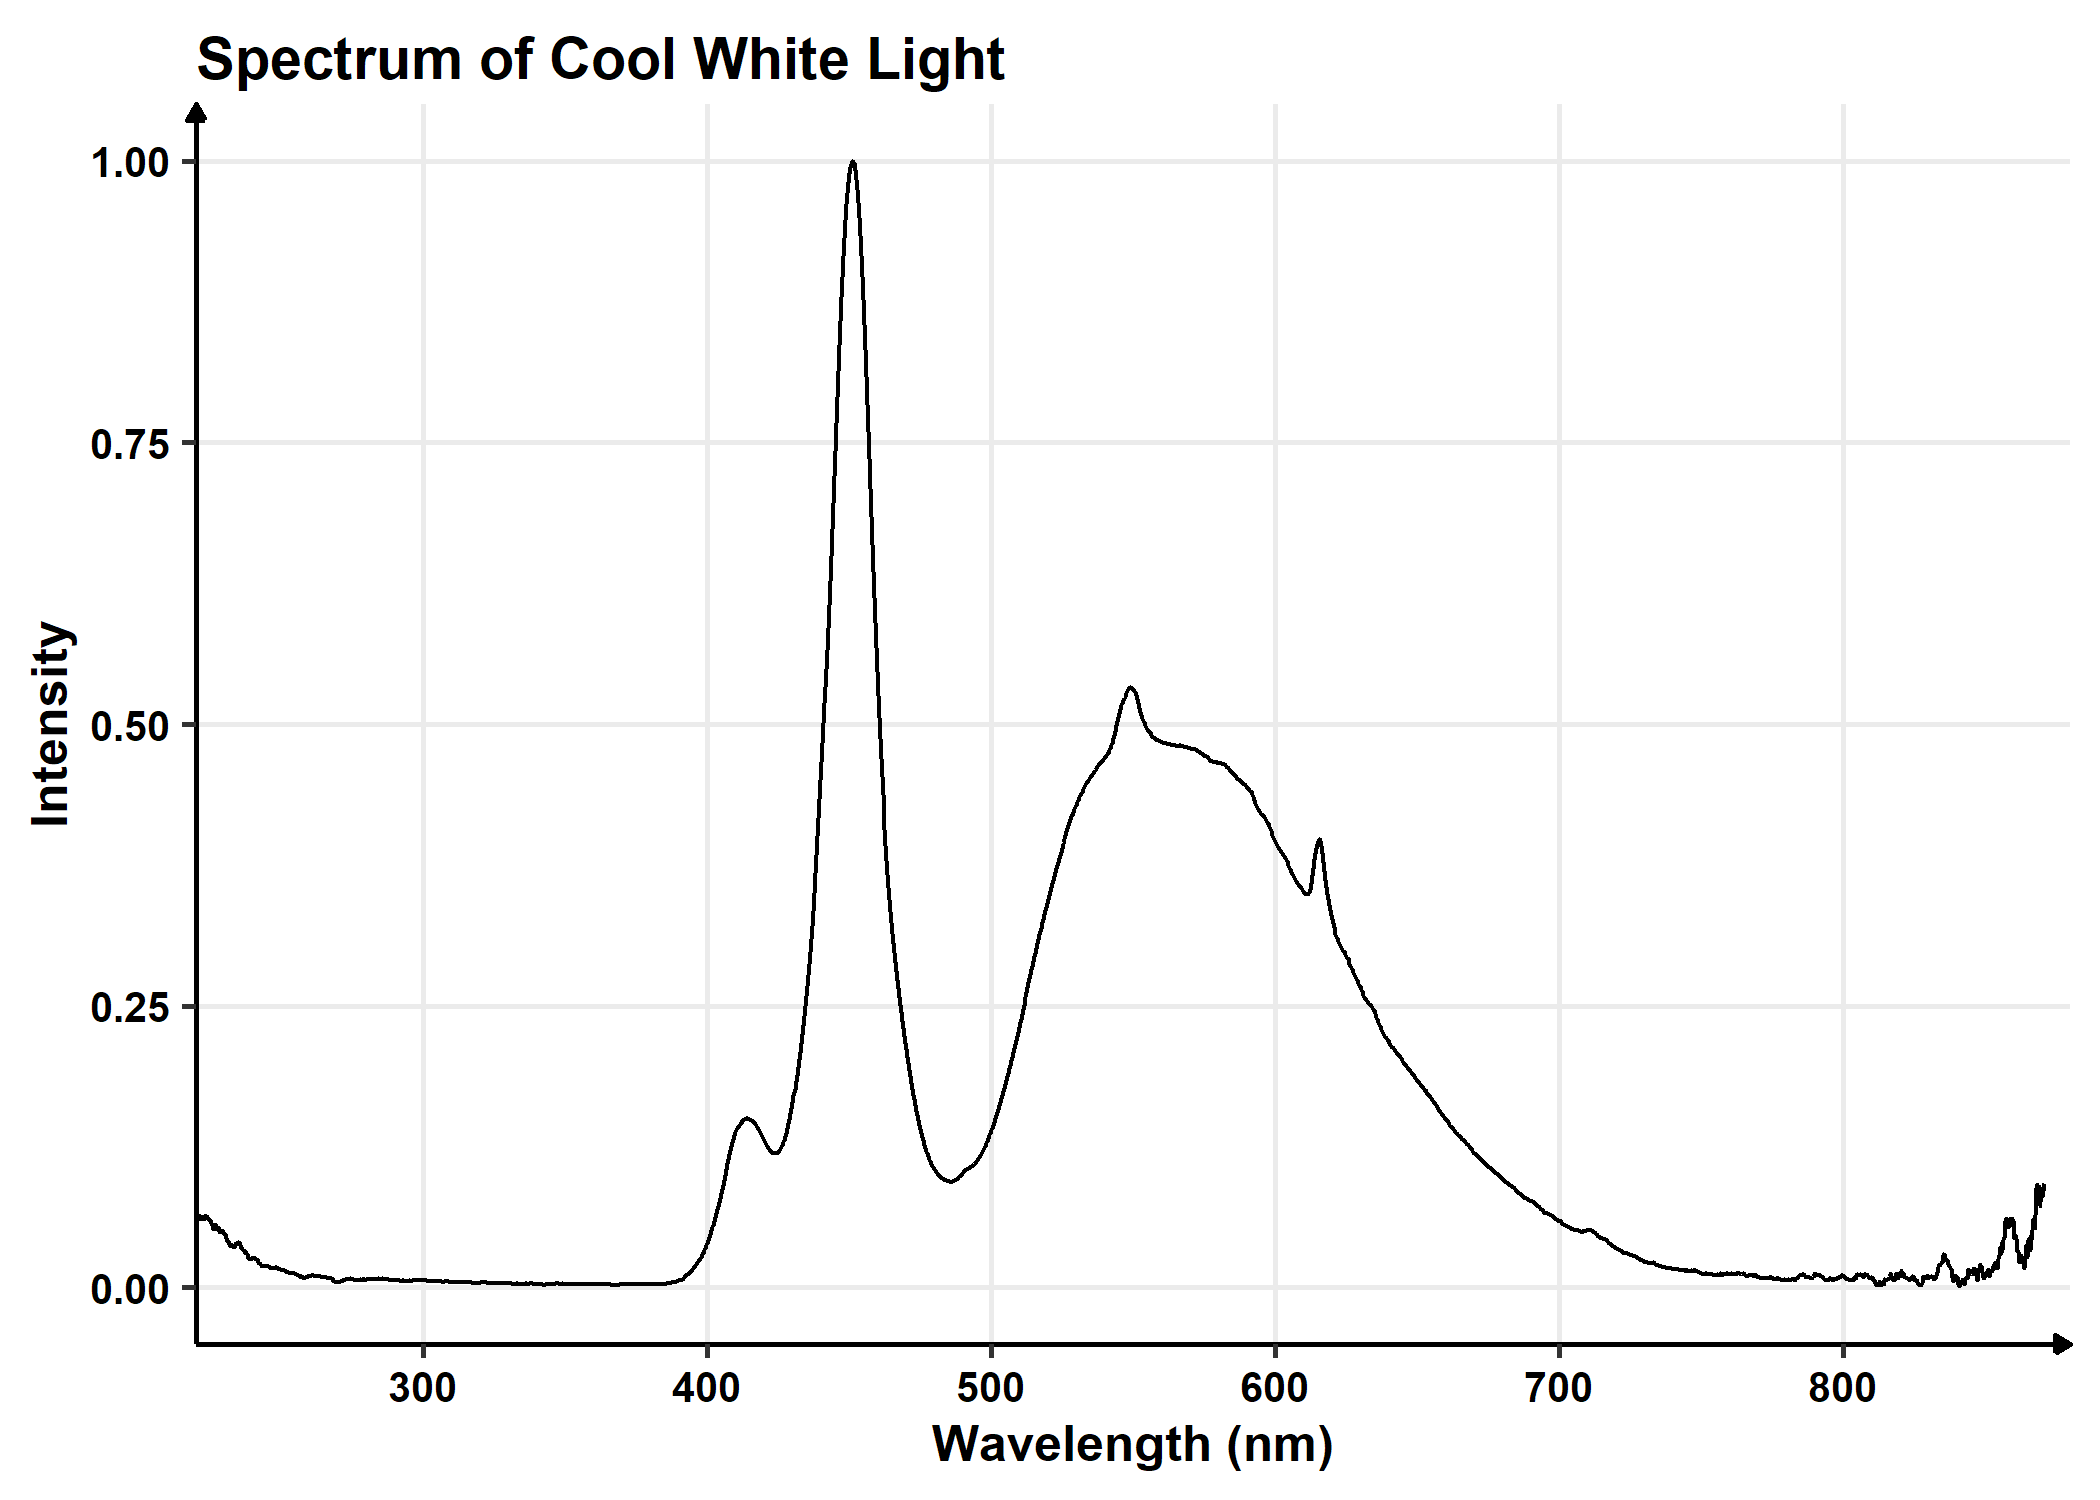
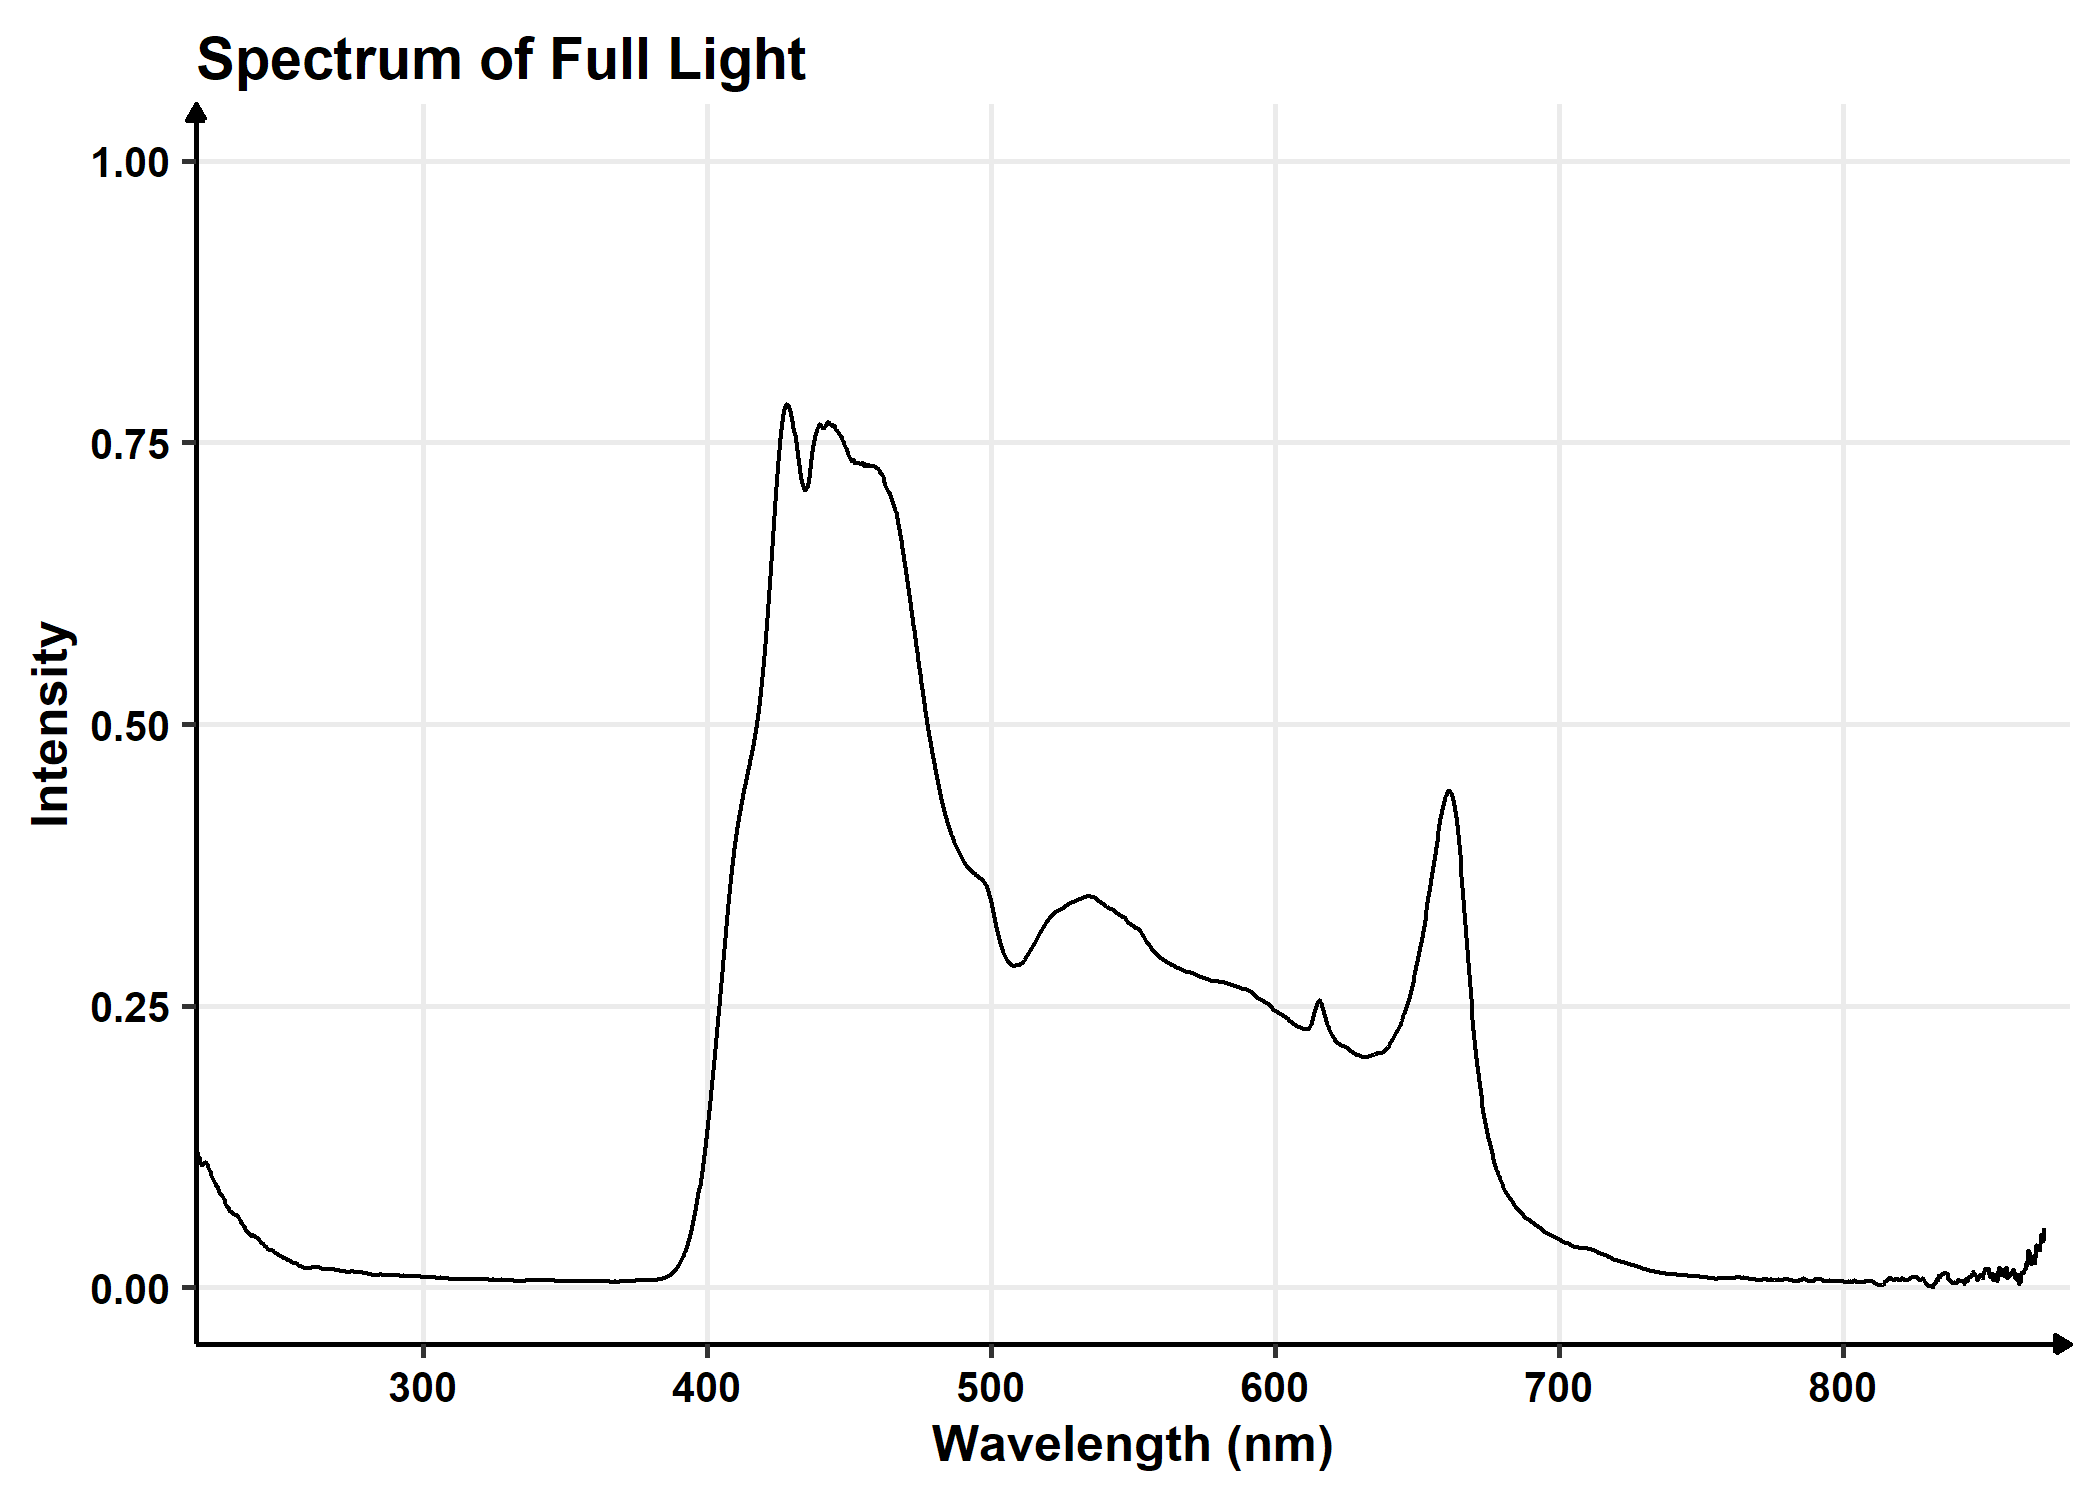
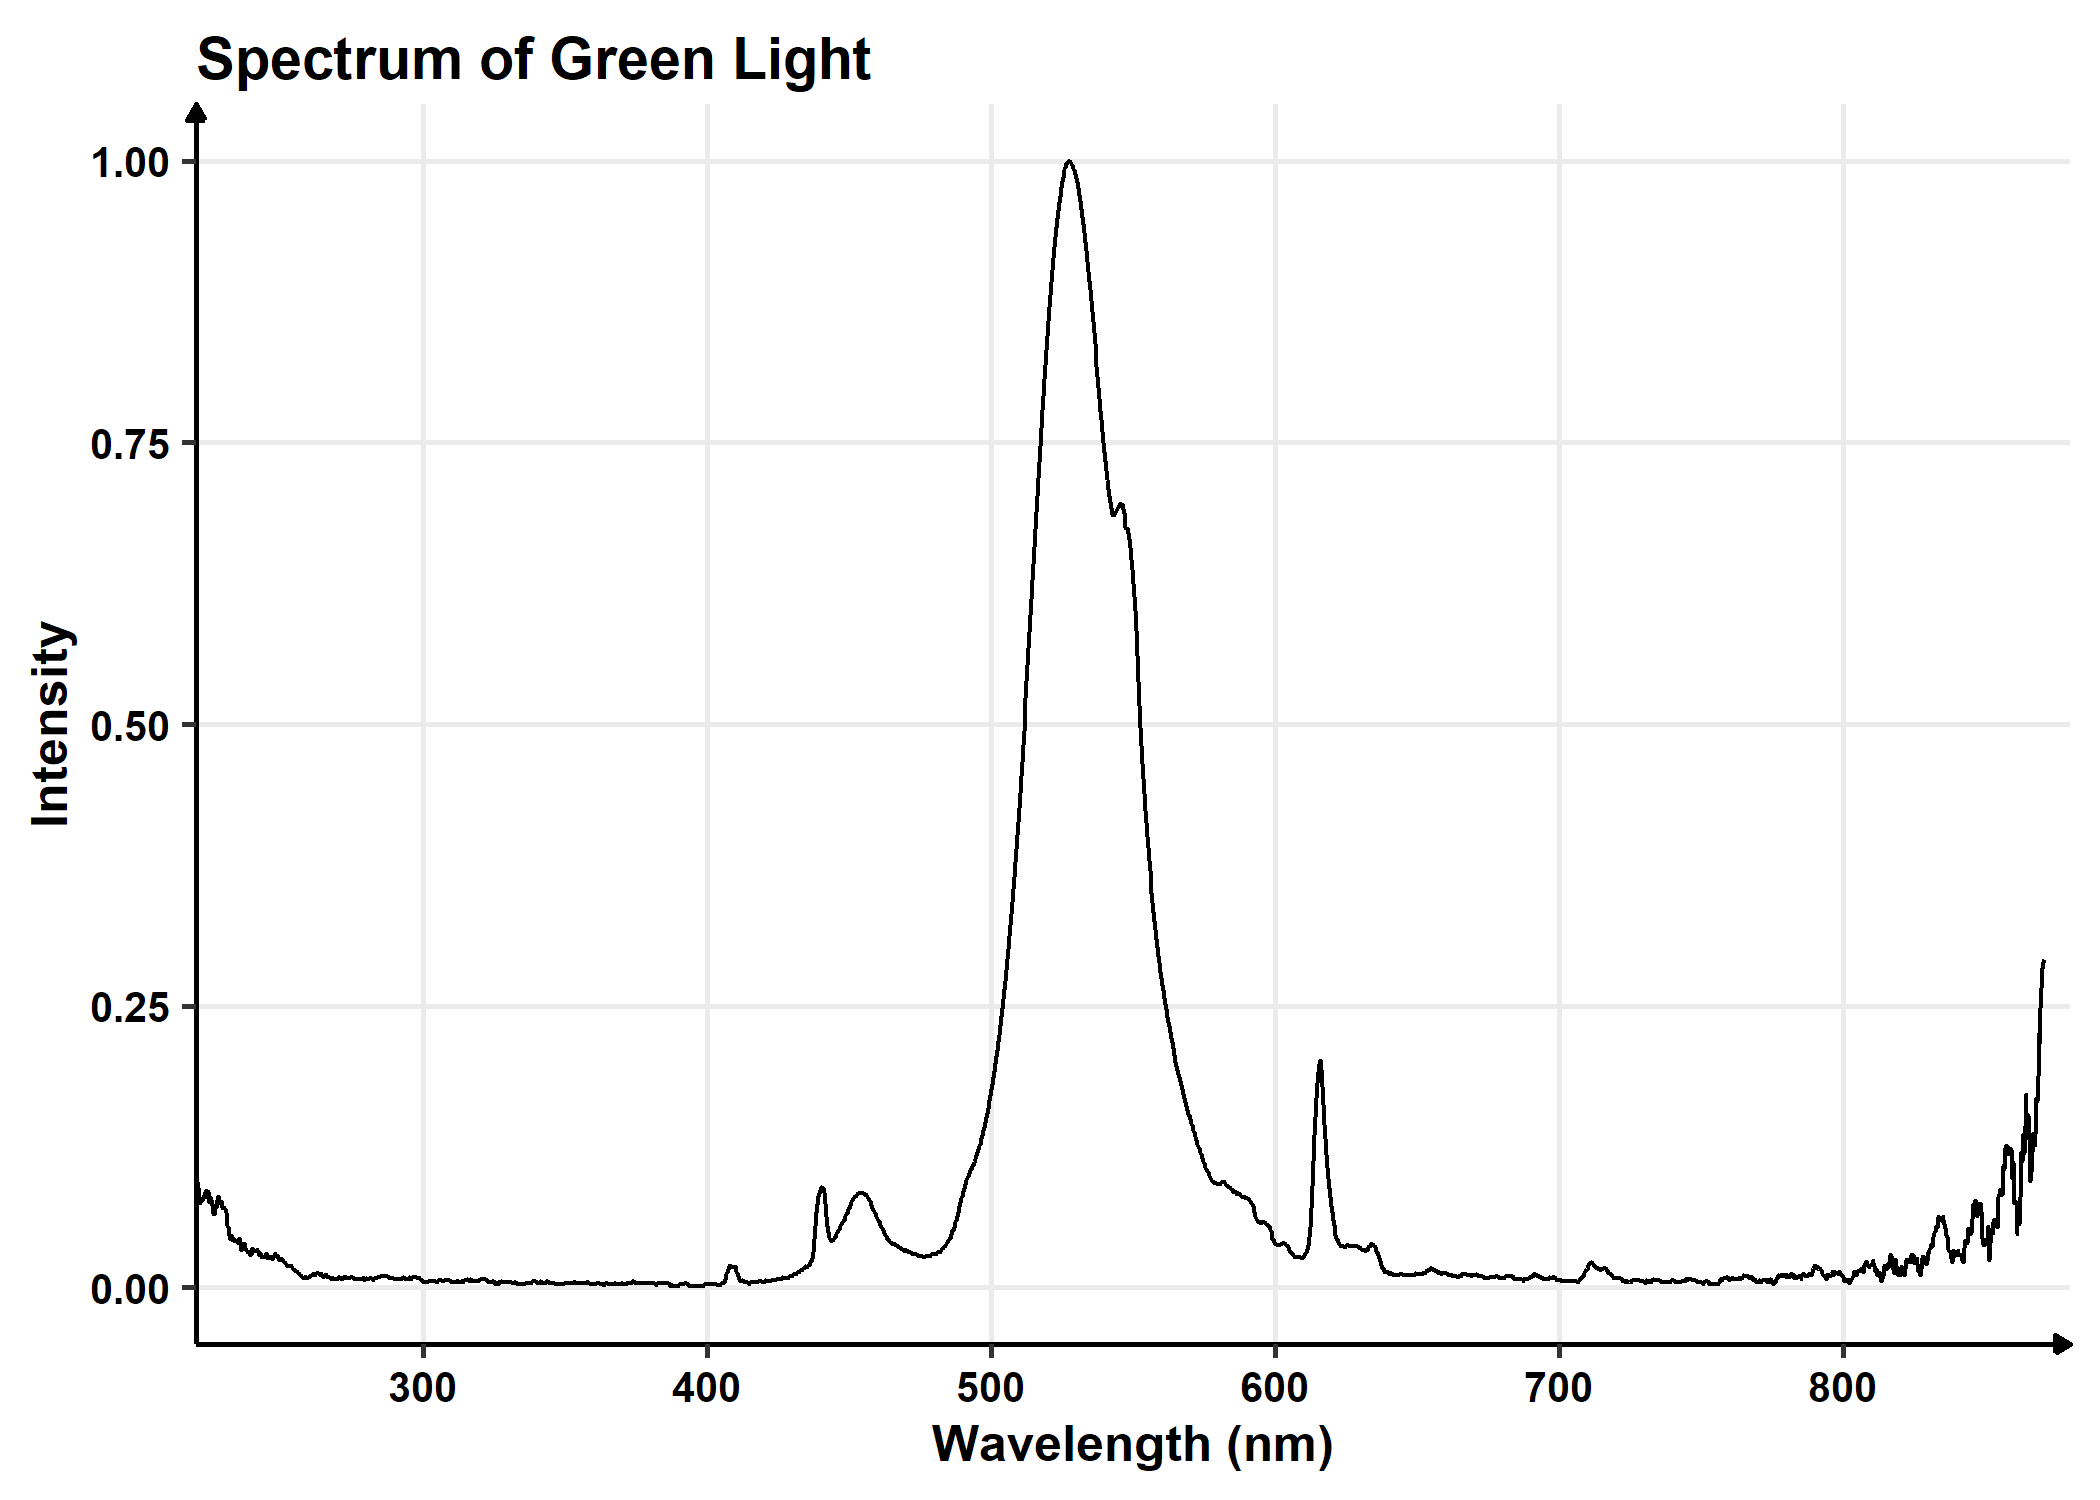
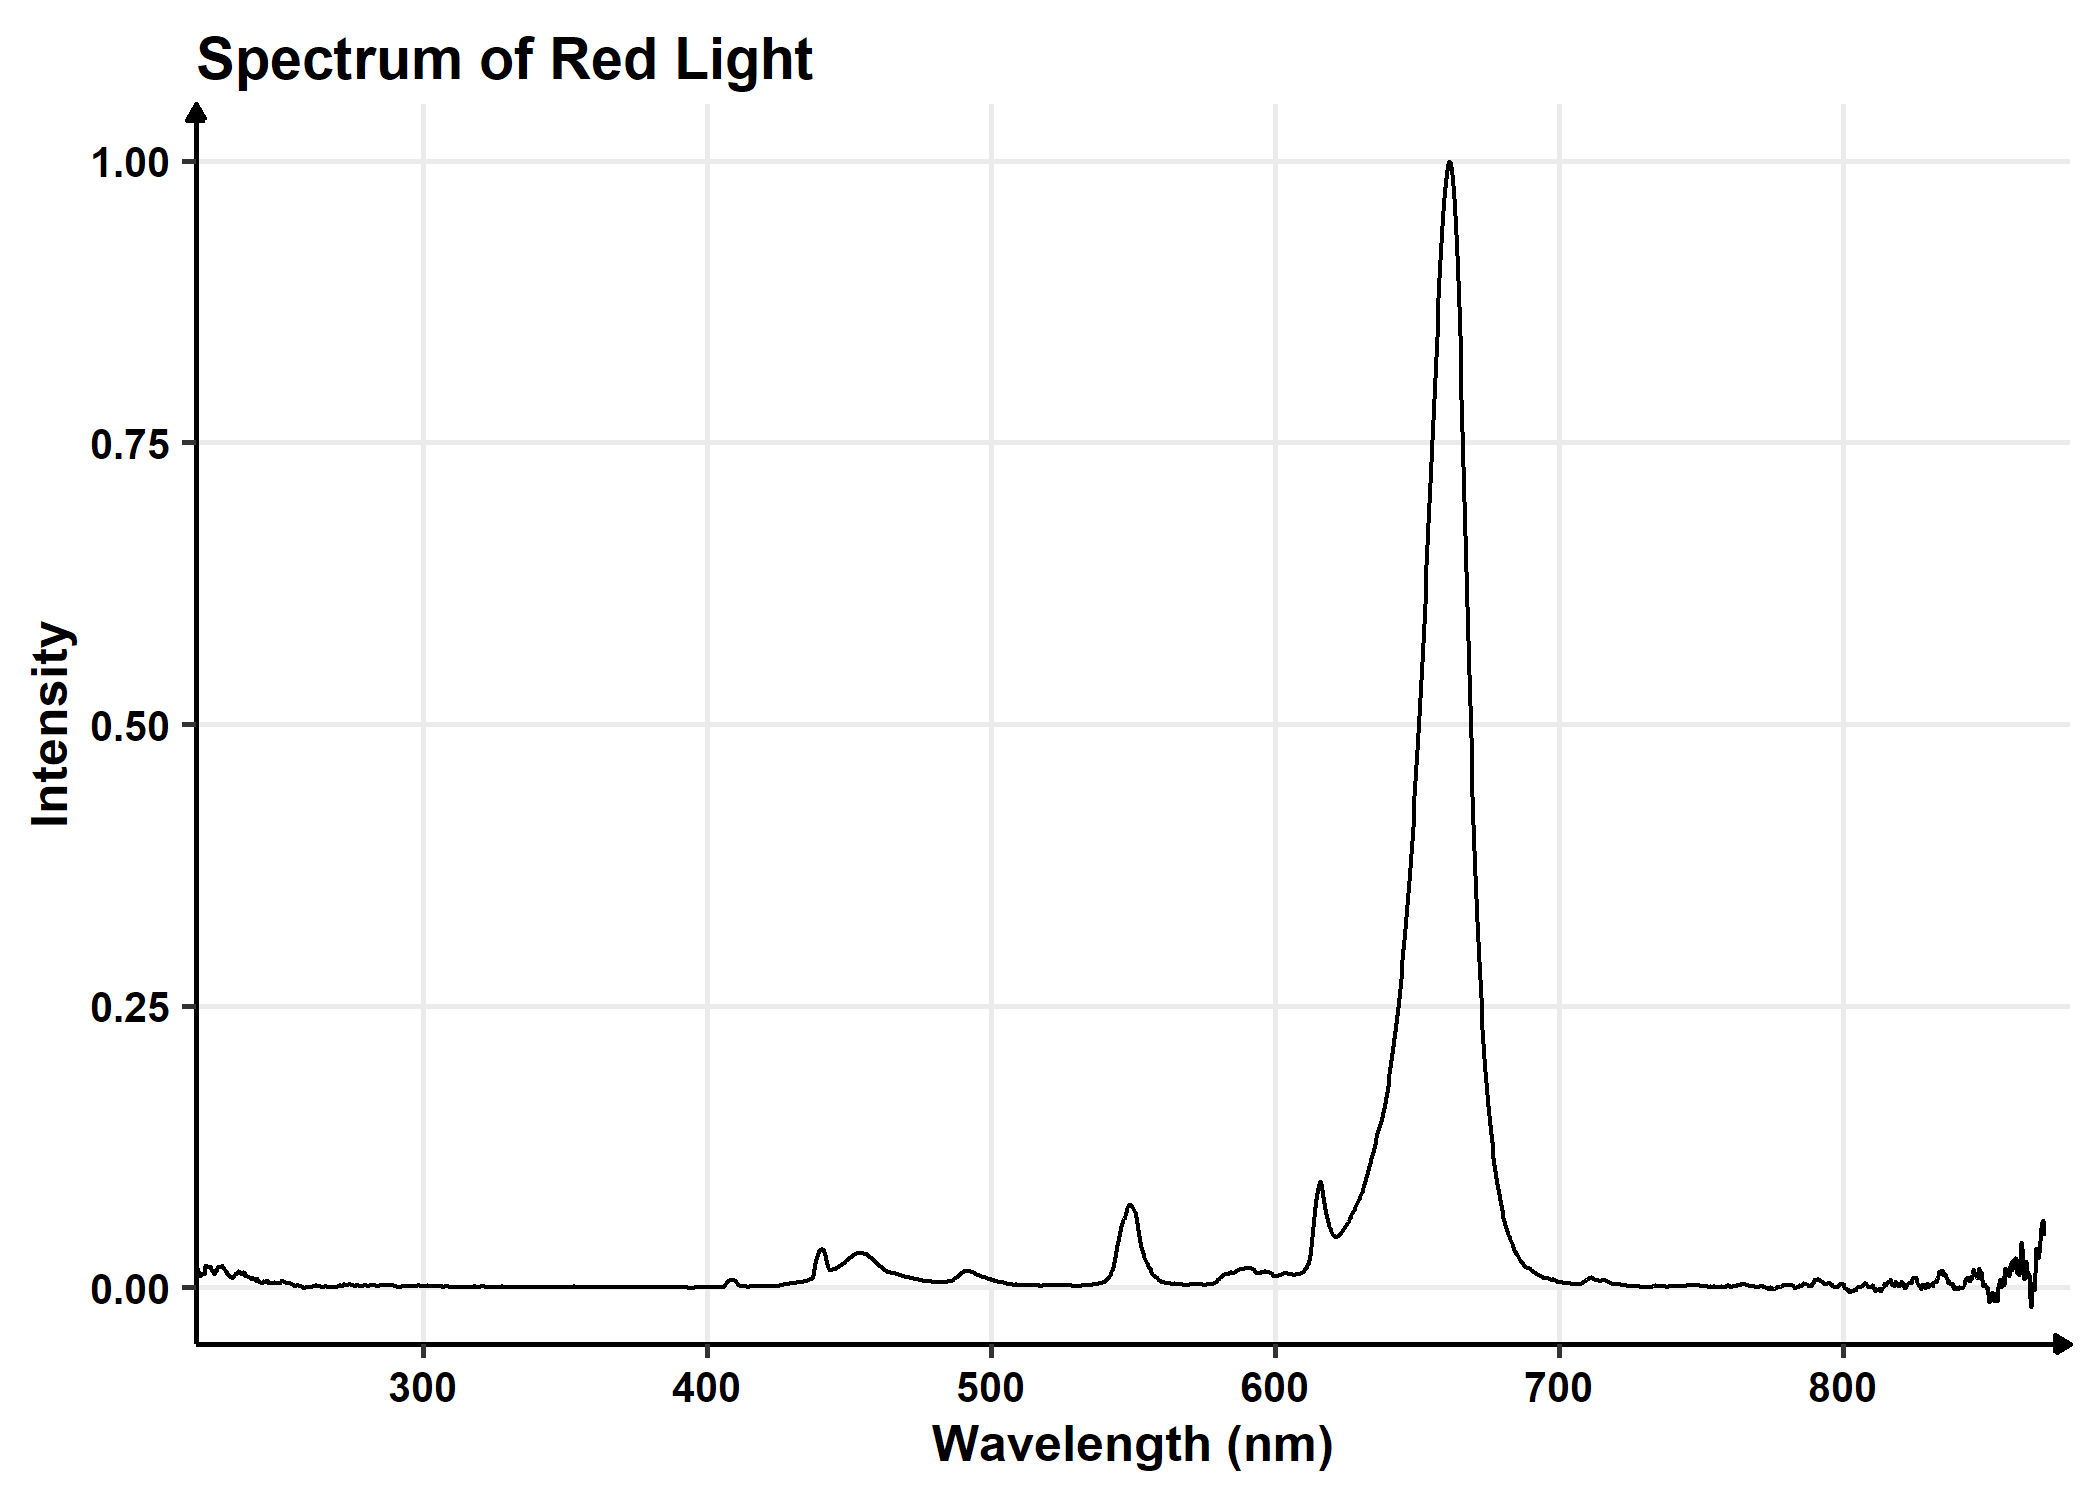
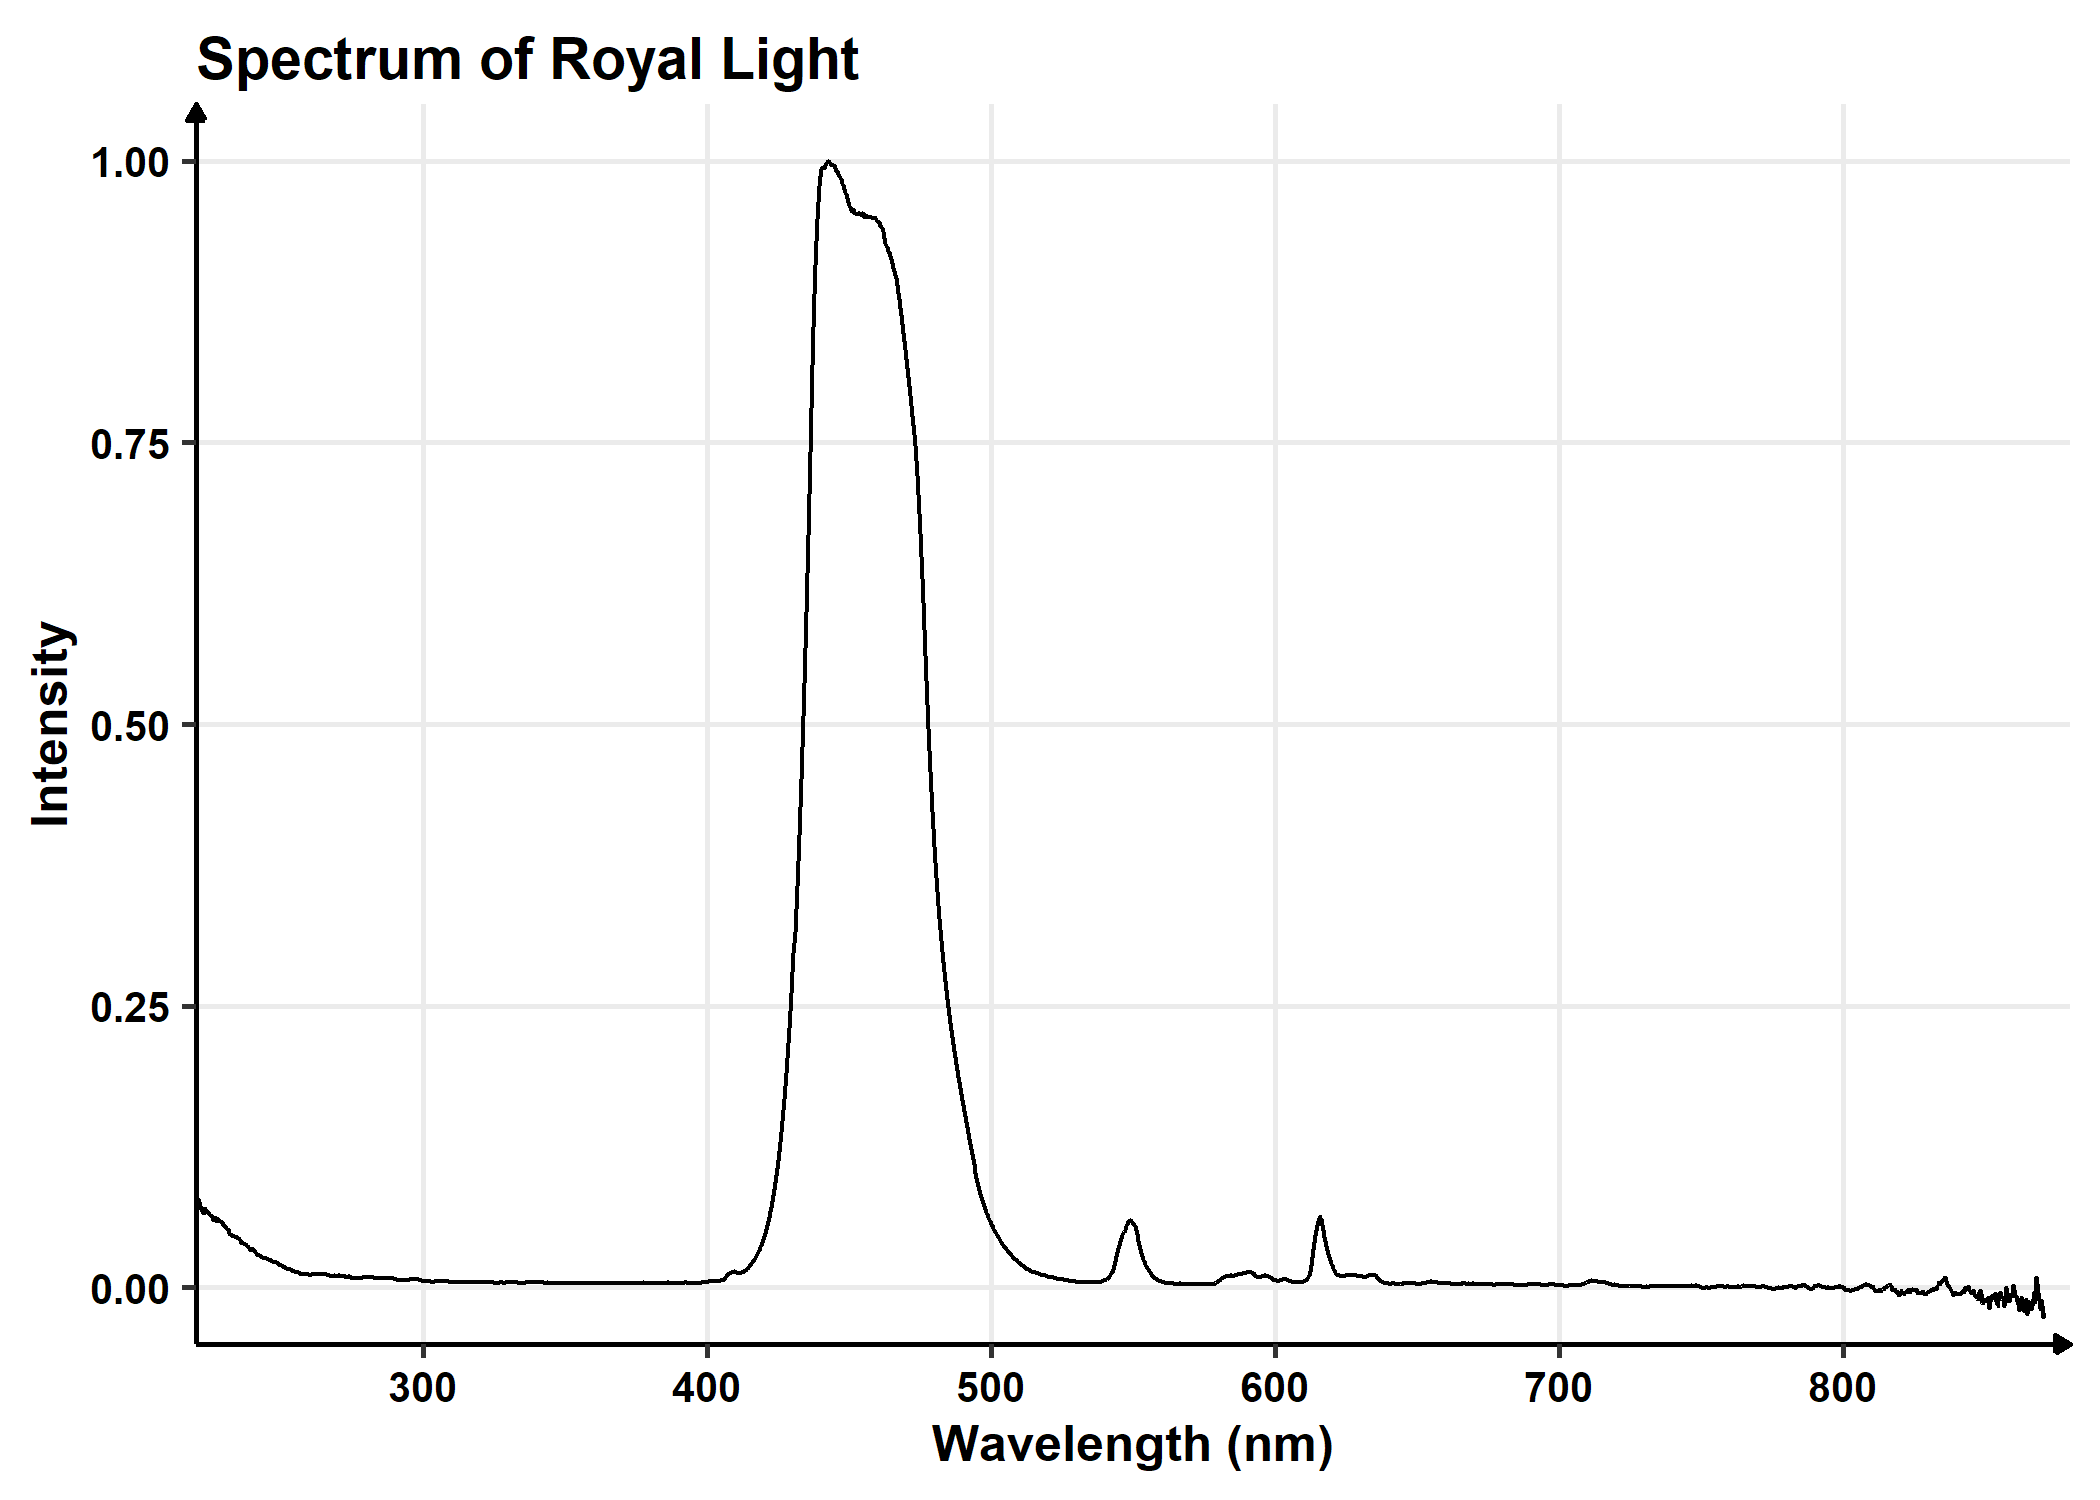
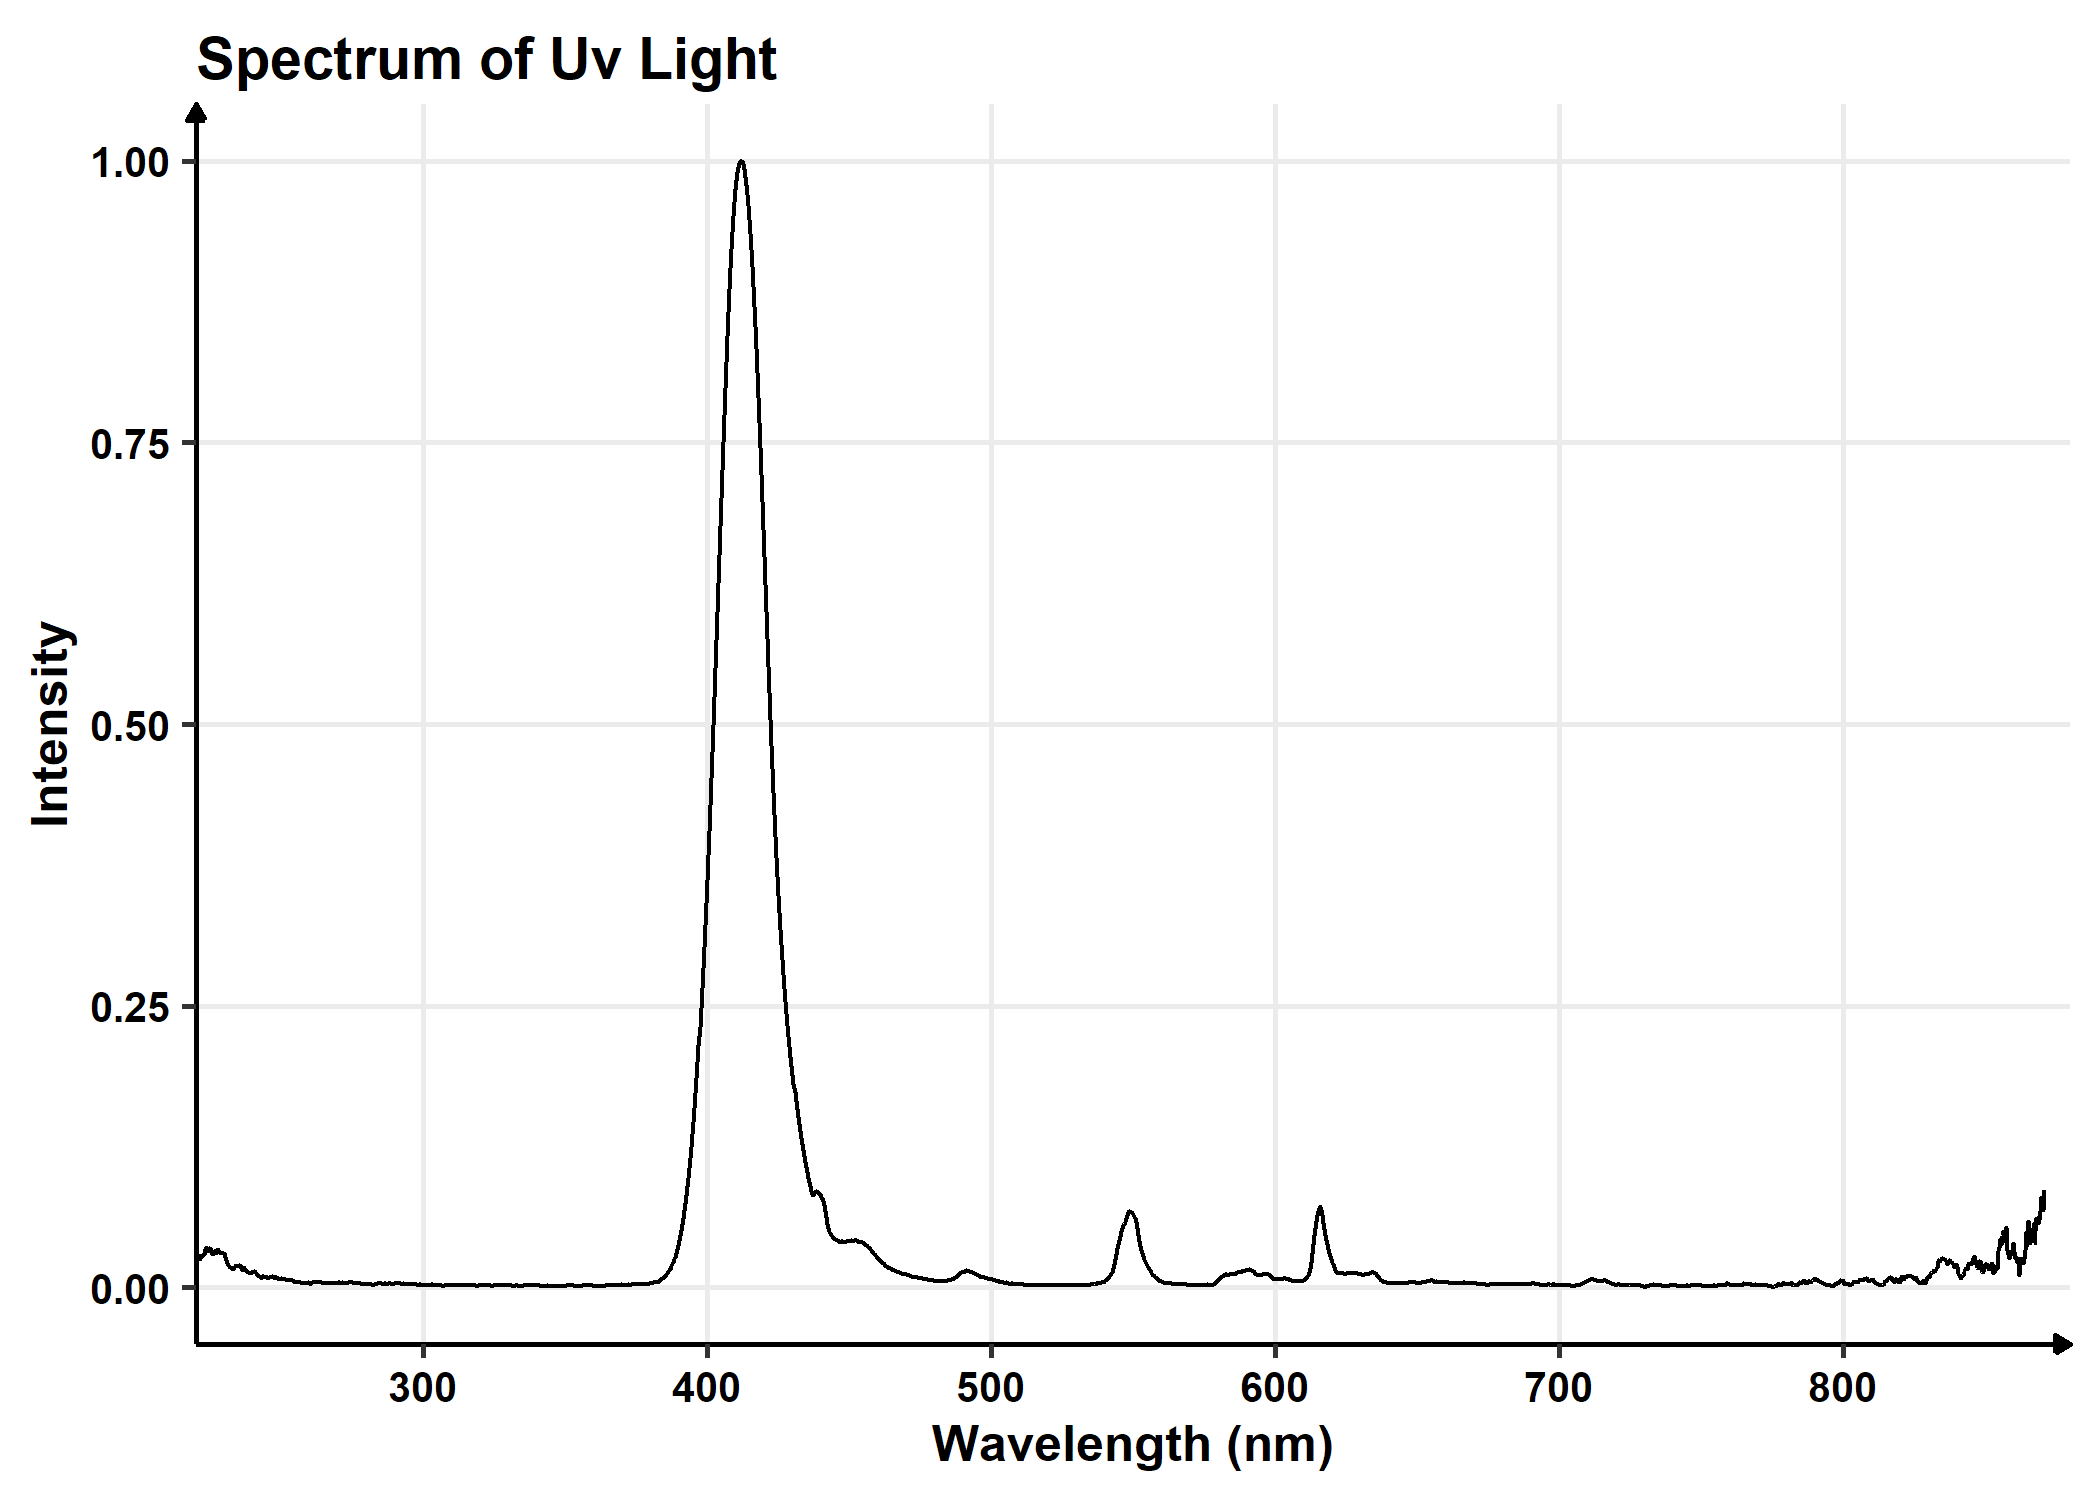
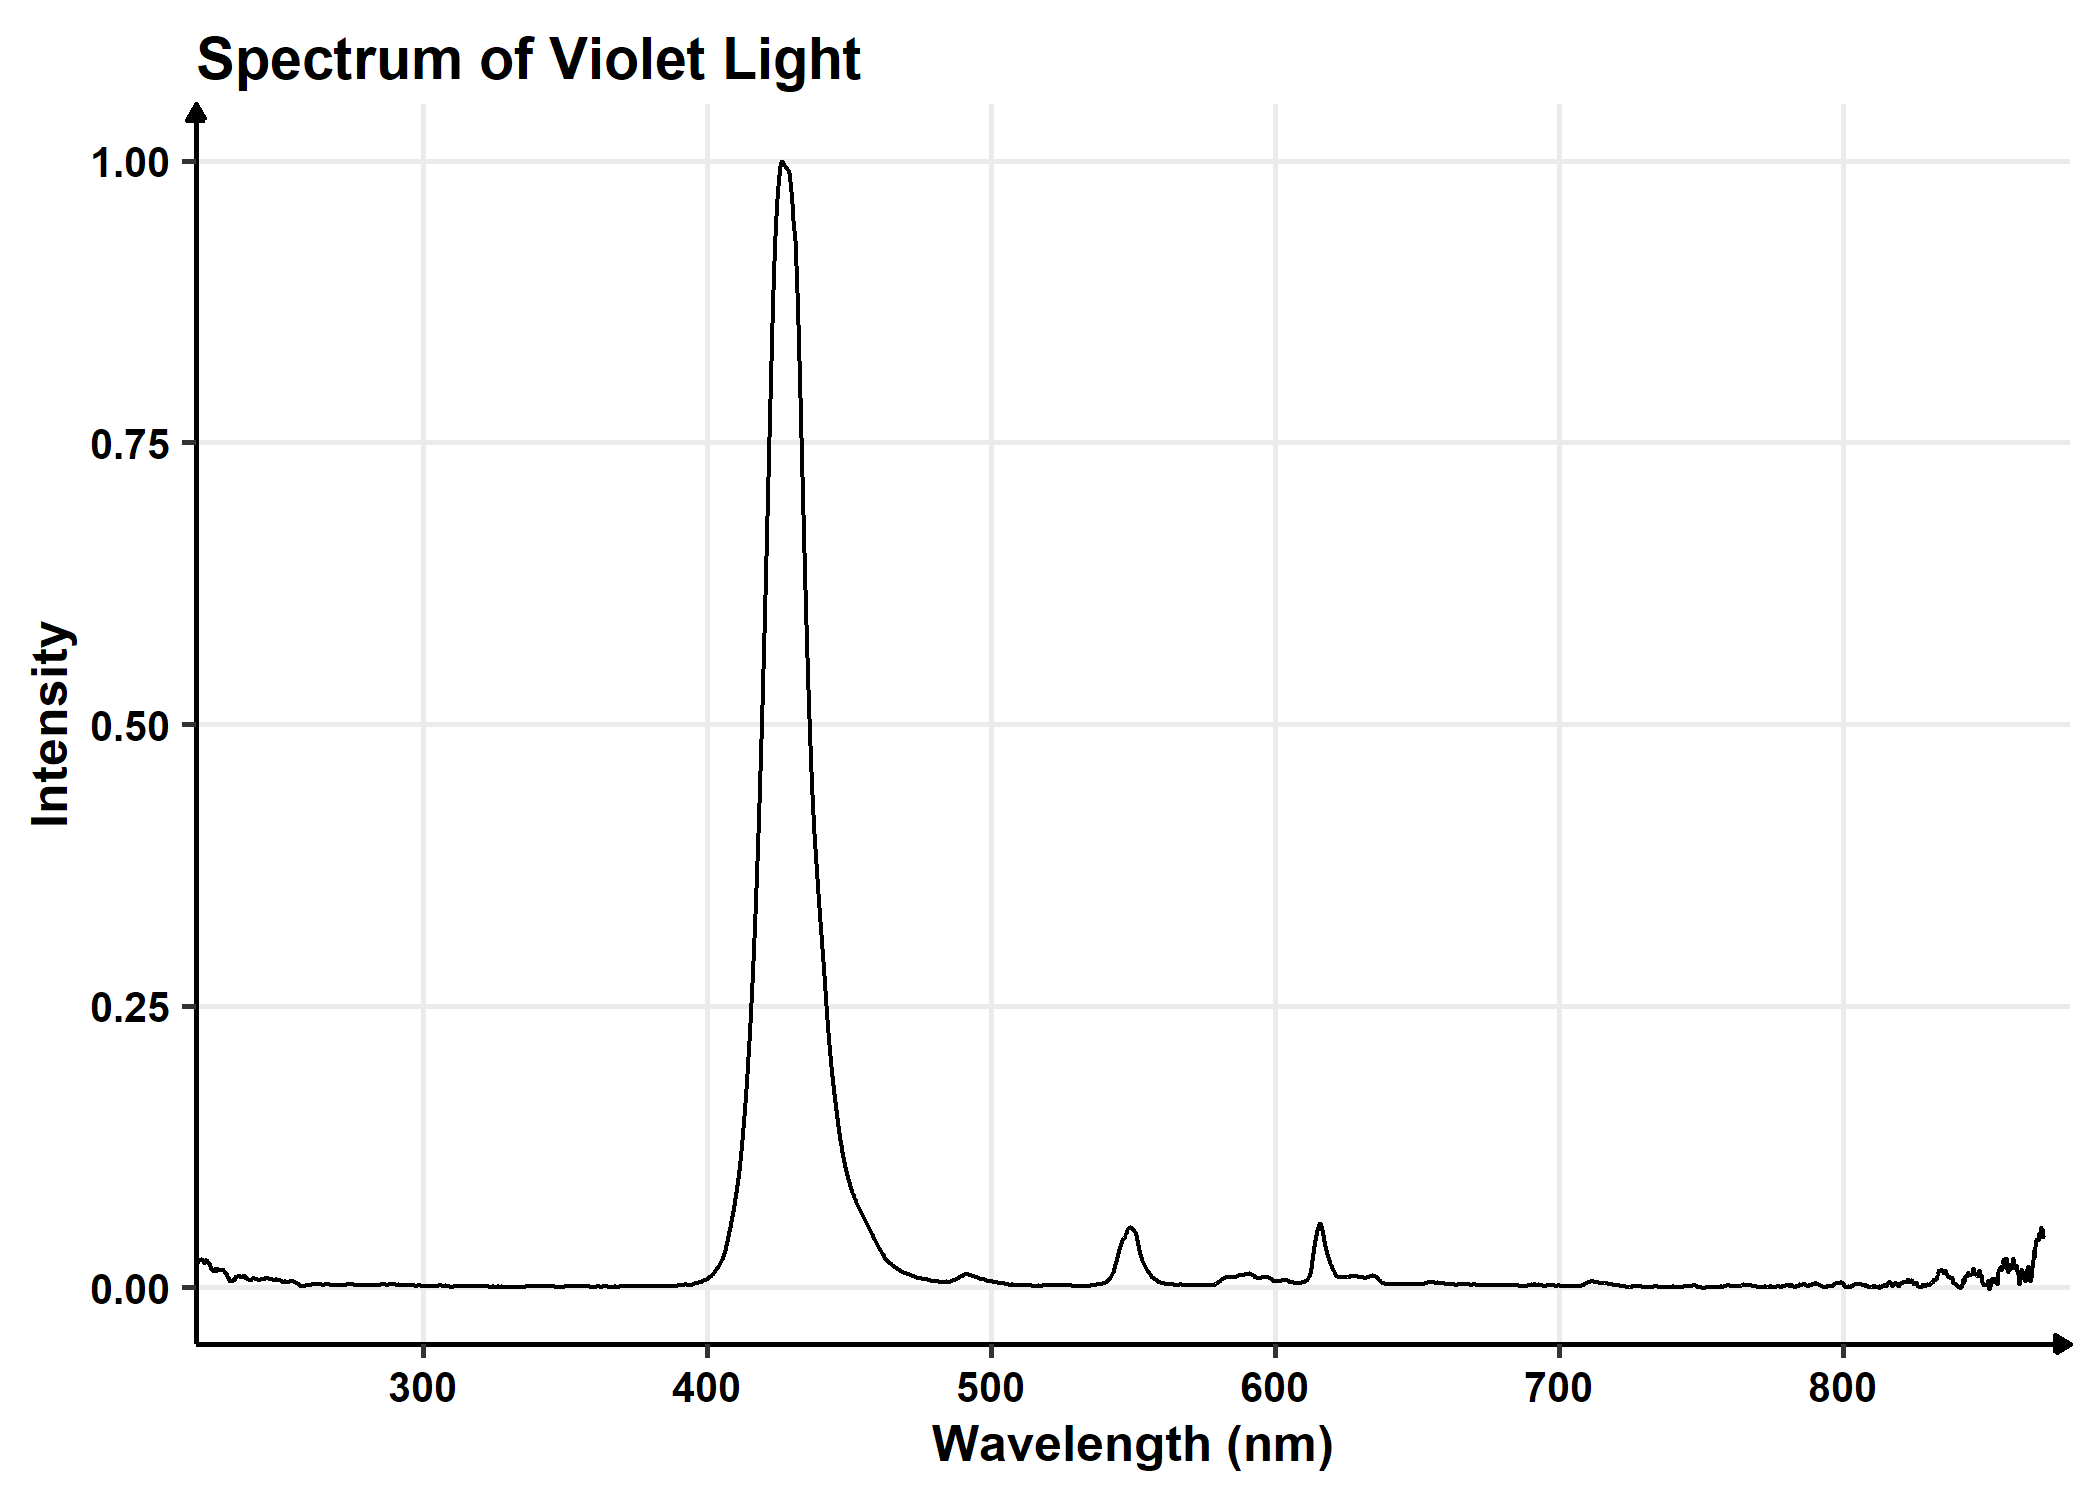
We can leverage these spectra to create the simulated sunlight we desire.
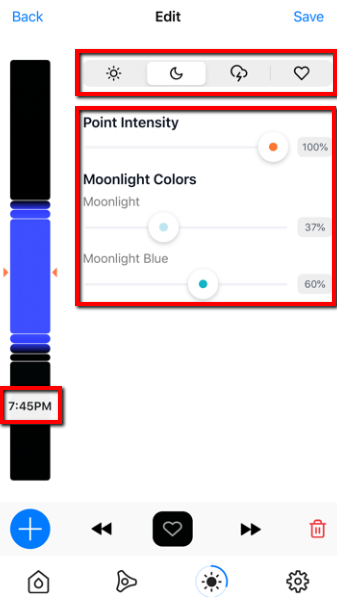
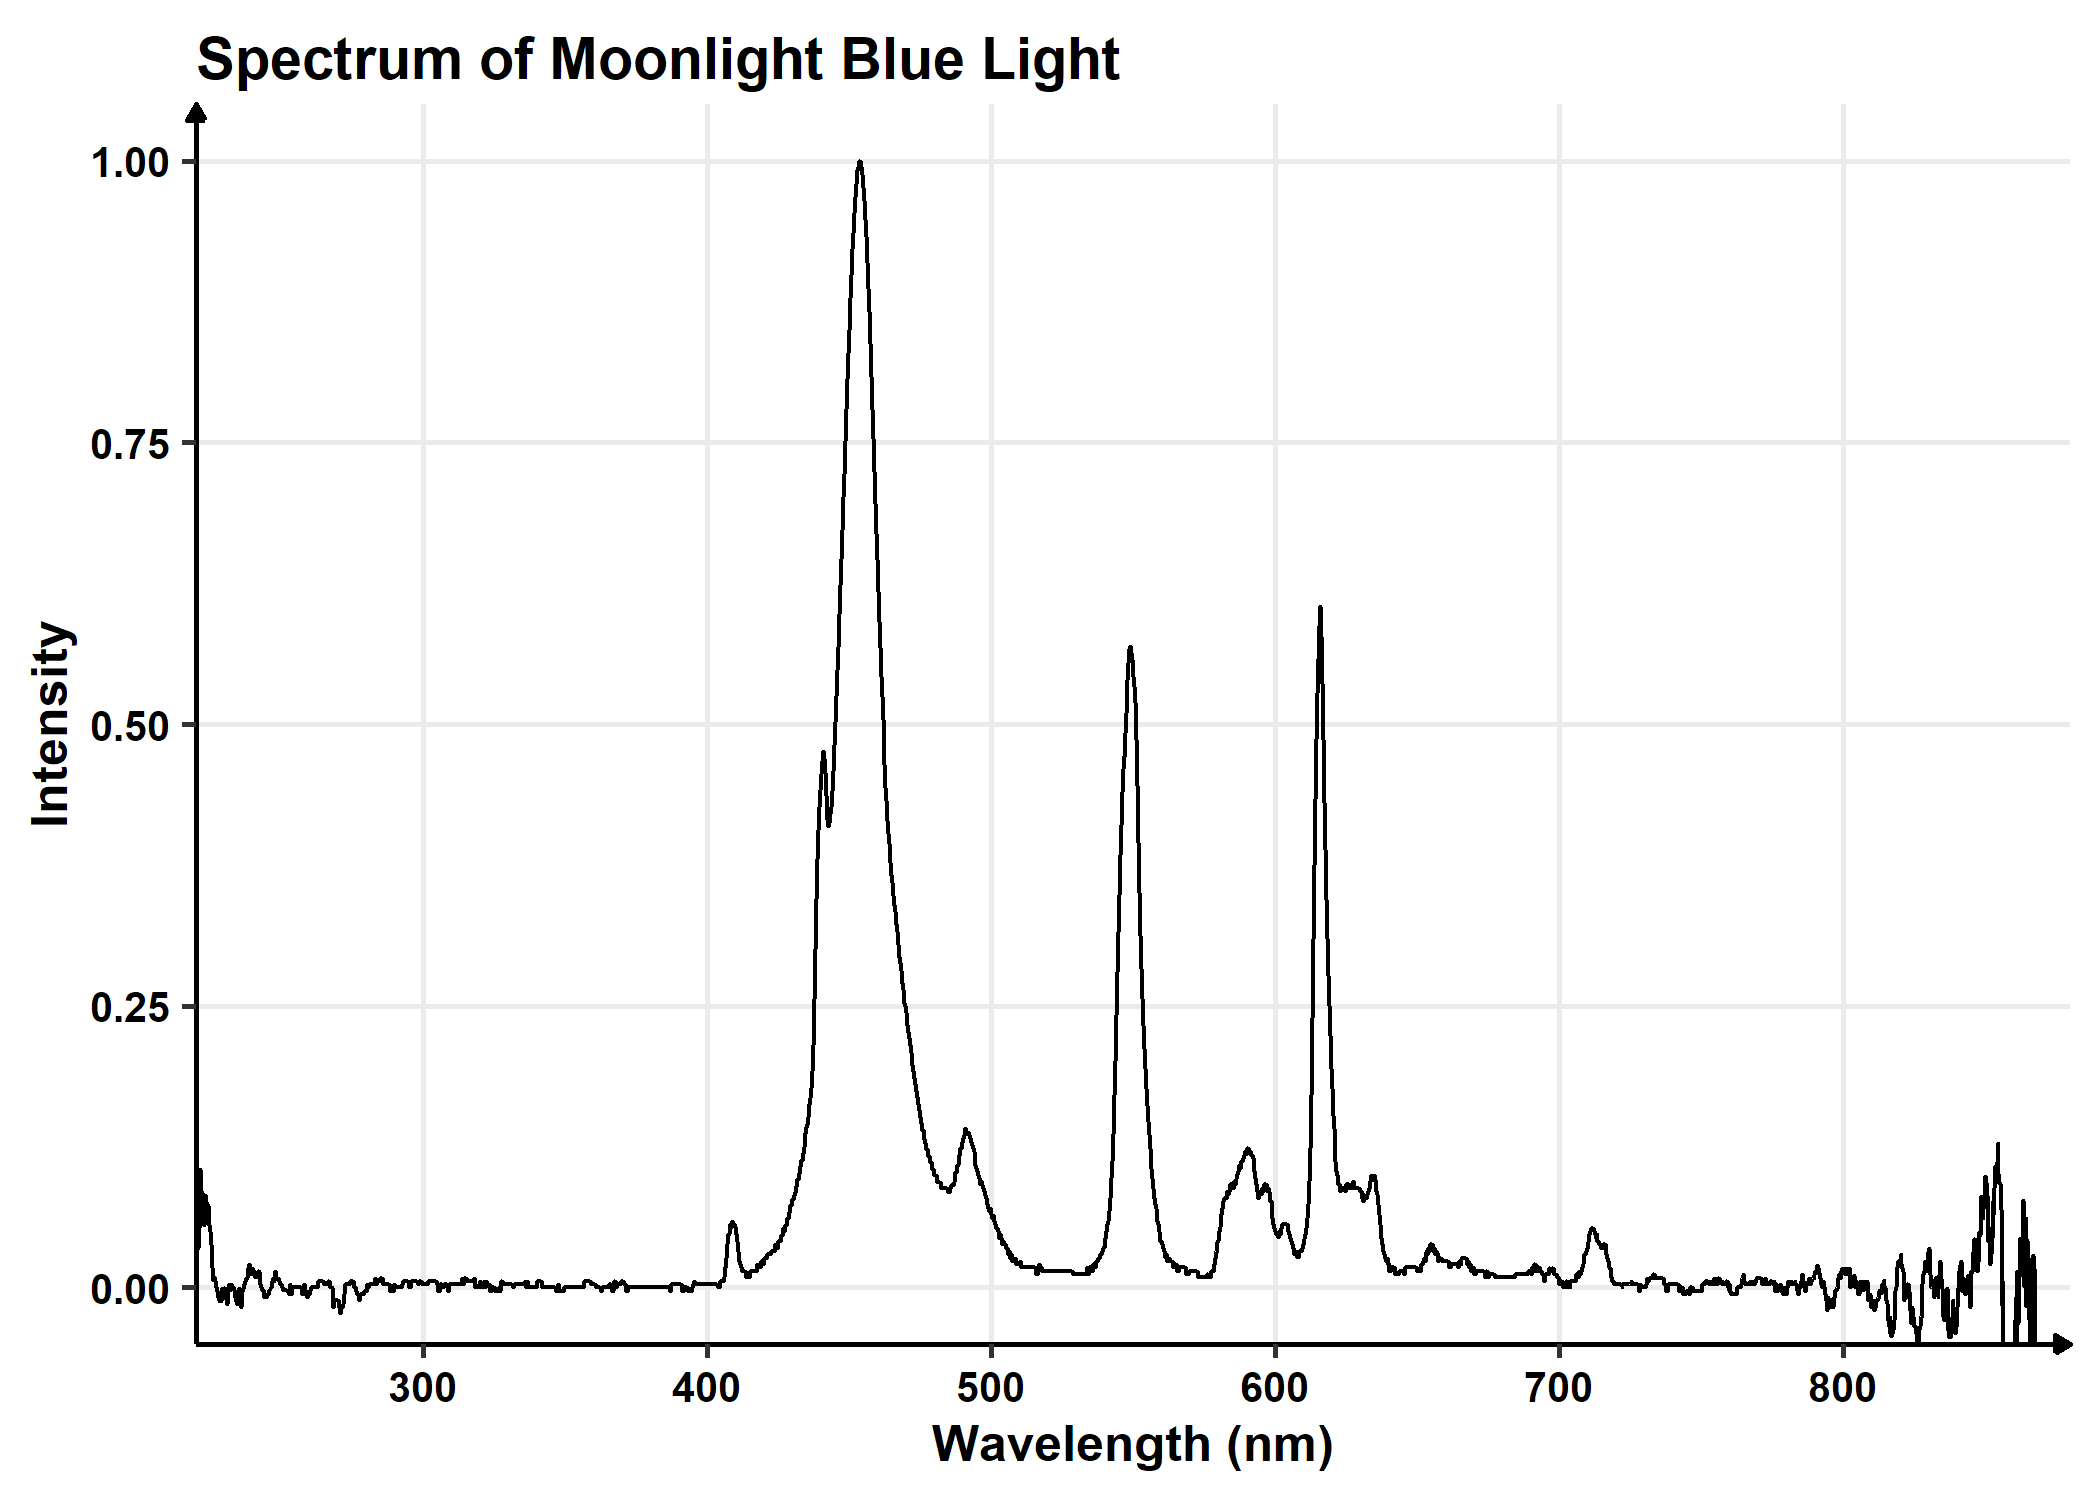
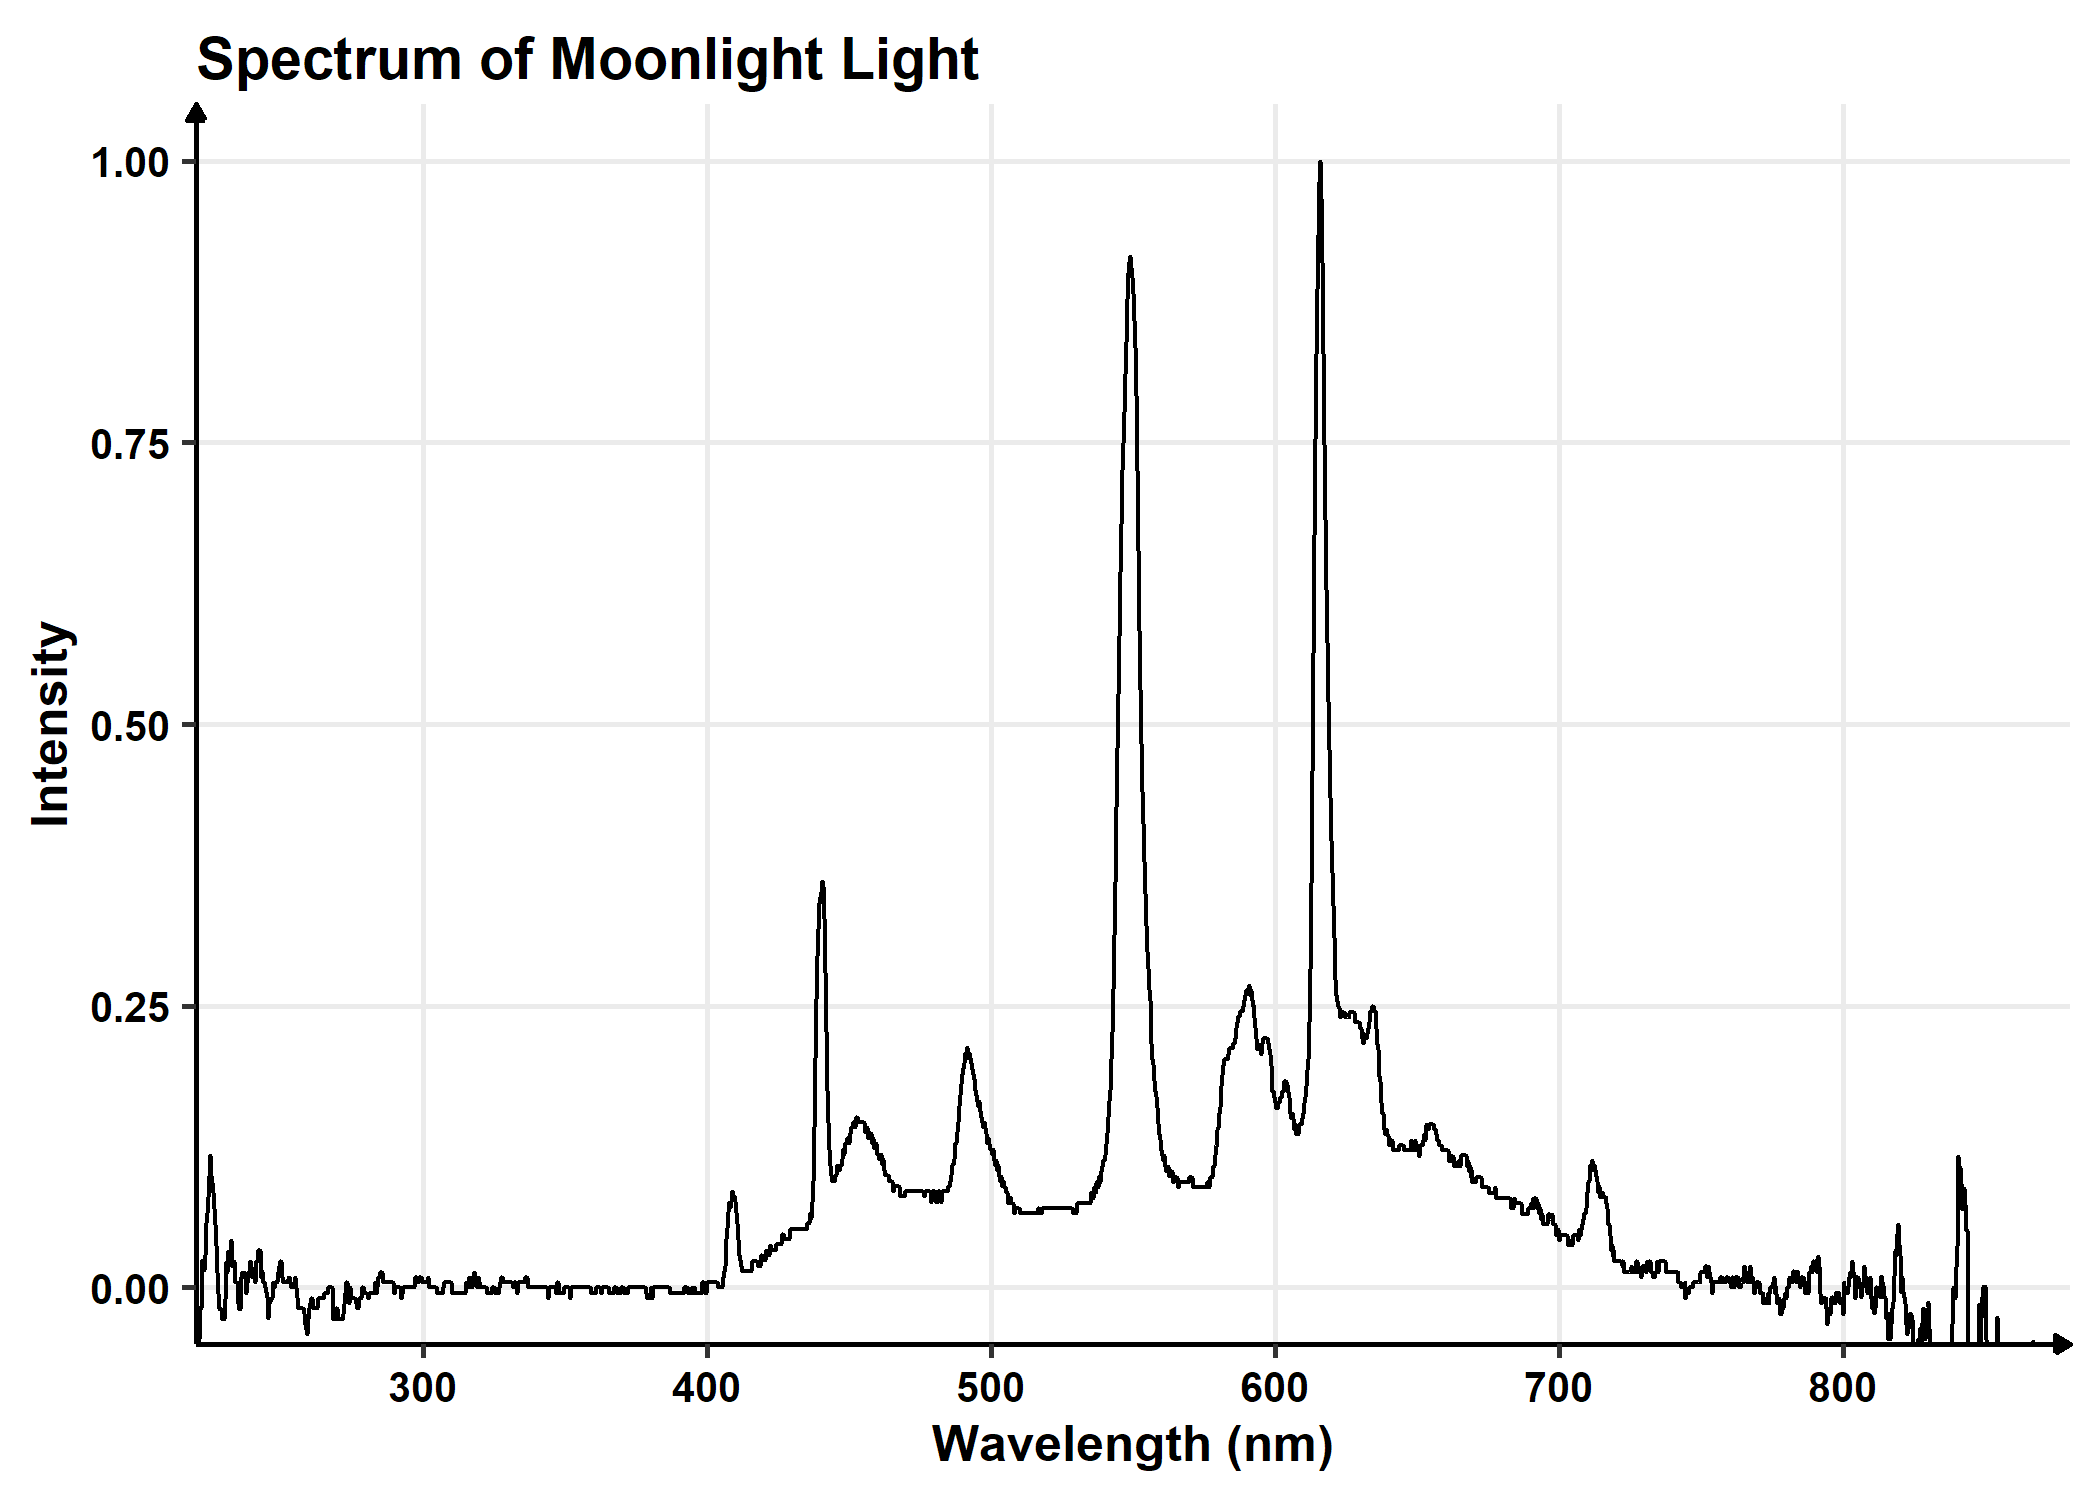
Moonlight
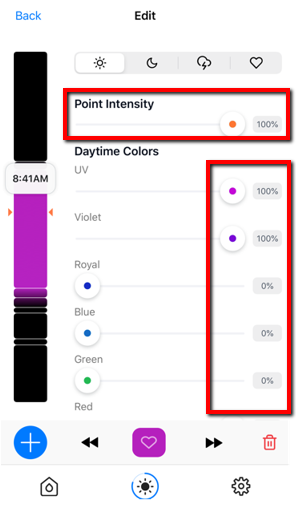
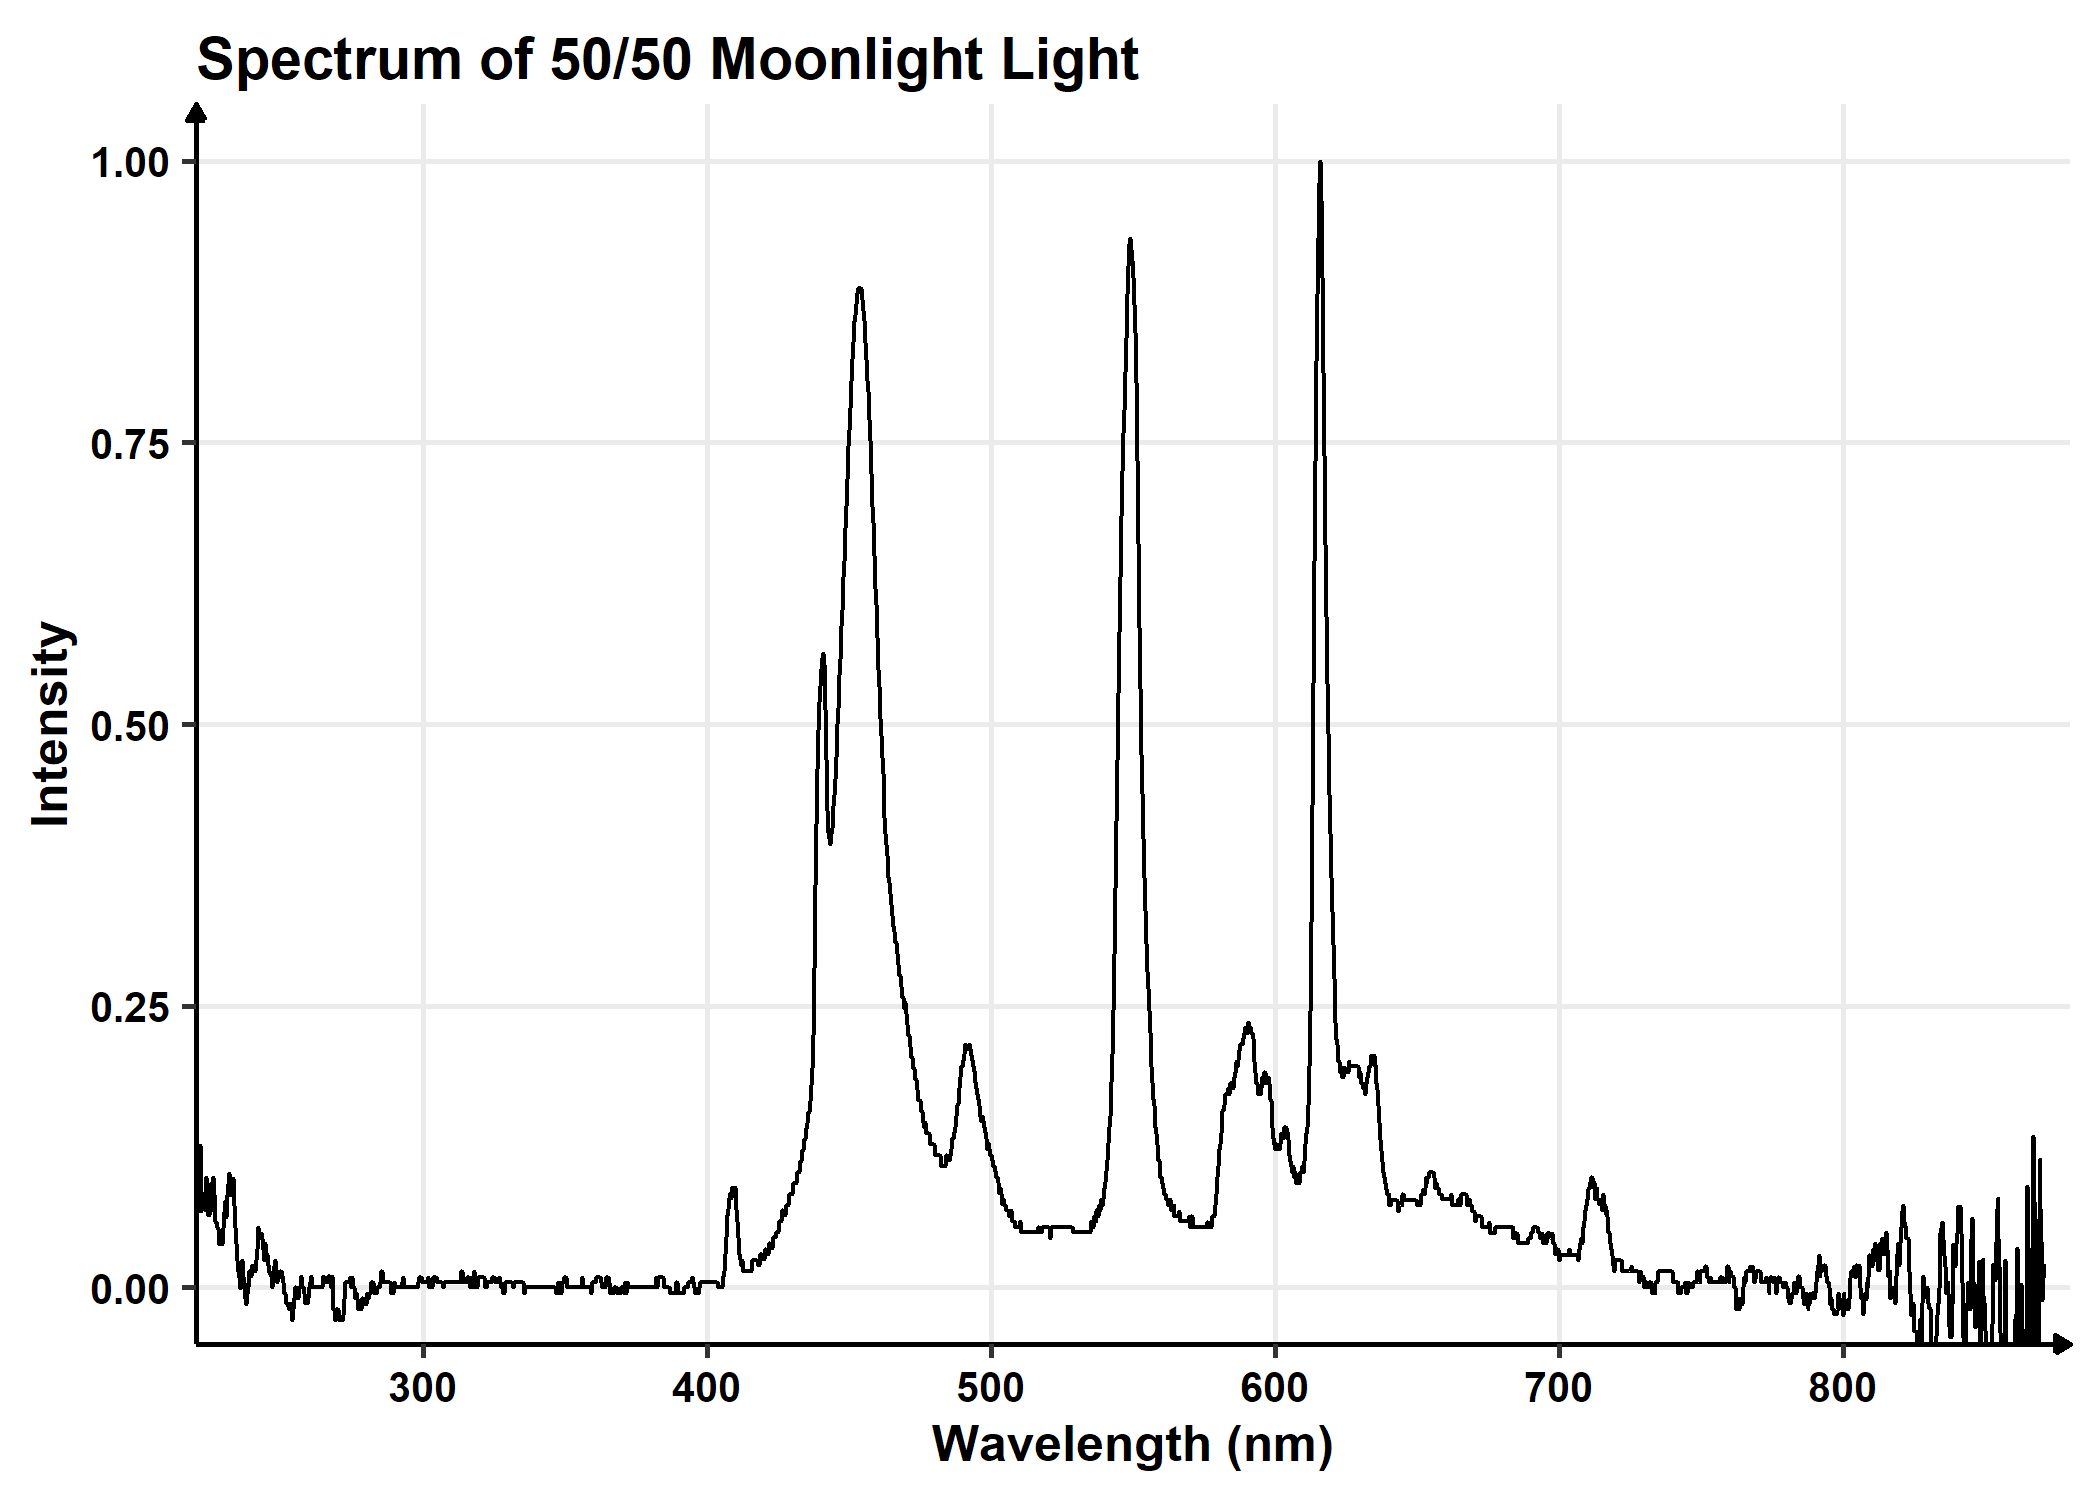
Through the Mobius app, we can adjust 4 parameters to mimic moonlight: intensity, color channel balance (Moonlight/Moonlight Blue), set times, and lunar cycle. At maximum intensity, the light is only outputting 2 PAR. Below are 3 spectra of the lights set at 100% Moonlight, 100% Moonlight Blue, and 50% for each Moonlight and Moonlight Blue.
We can also enable lunar cycle which creates a 28 day cycle with each day resulting in a scaled brightness. For instance, if the full moon is day 0 and point brightness is set to 100%, then on day 0 the brightness will be 100%. On day 7 (last quarter) the brightness would be 50%. On day 14 (new moon), the light will not come on at all. This cycles through and scales to whatever one sets as the full moon settings. If lunar cycle is disabled, then the full settings will be applied each day.
Seasonal
To mimic seasonal changes in the light regime, Mobius has a tool called Insolation which permits dynamic daily adjustments of the light schedule. One imports a table that specifies the sunrise, sunset, sun intensity, moonrise, moonset, and moon intensity. This tool allows users to upload a csv of setpoints for an entire year.
This table will work together with the setpoints one sets to create a unique light curve for each day. You set the shape of the curve which is proportionally changed by the specific times set in the Insolation table.
Insolation is a beta feature and needs further testing. I’ve started a line of communication with the EcoTech Marine team to get this tool working for us, and I will keep you updated on that progress. If this tool works as advertised, it will permit experimentation on light seasonality.
Day Curves
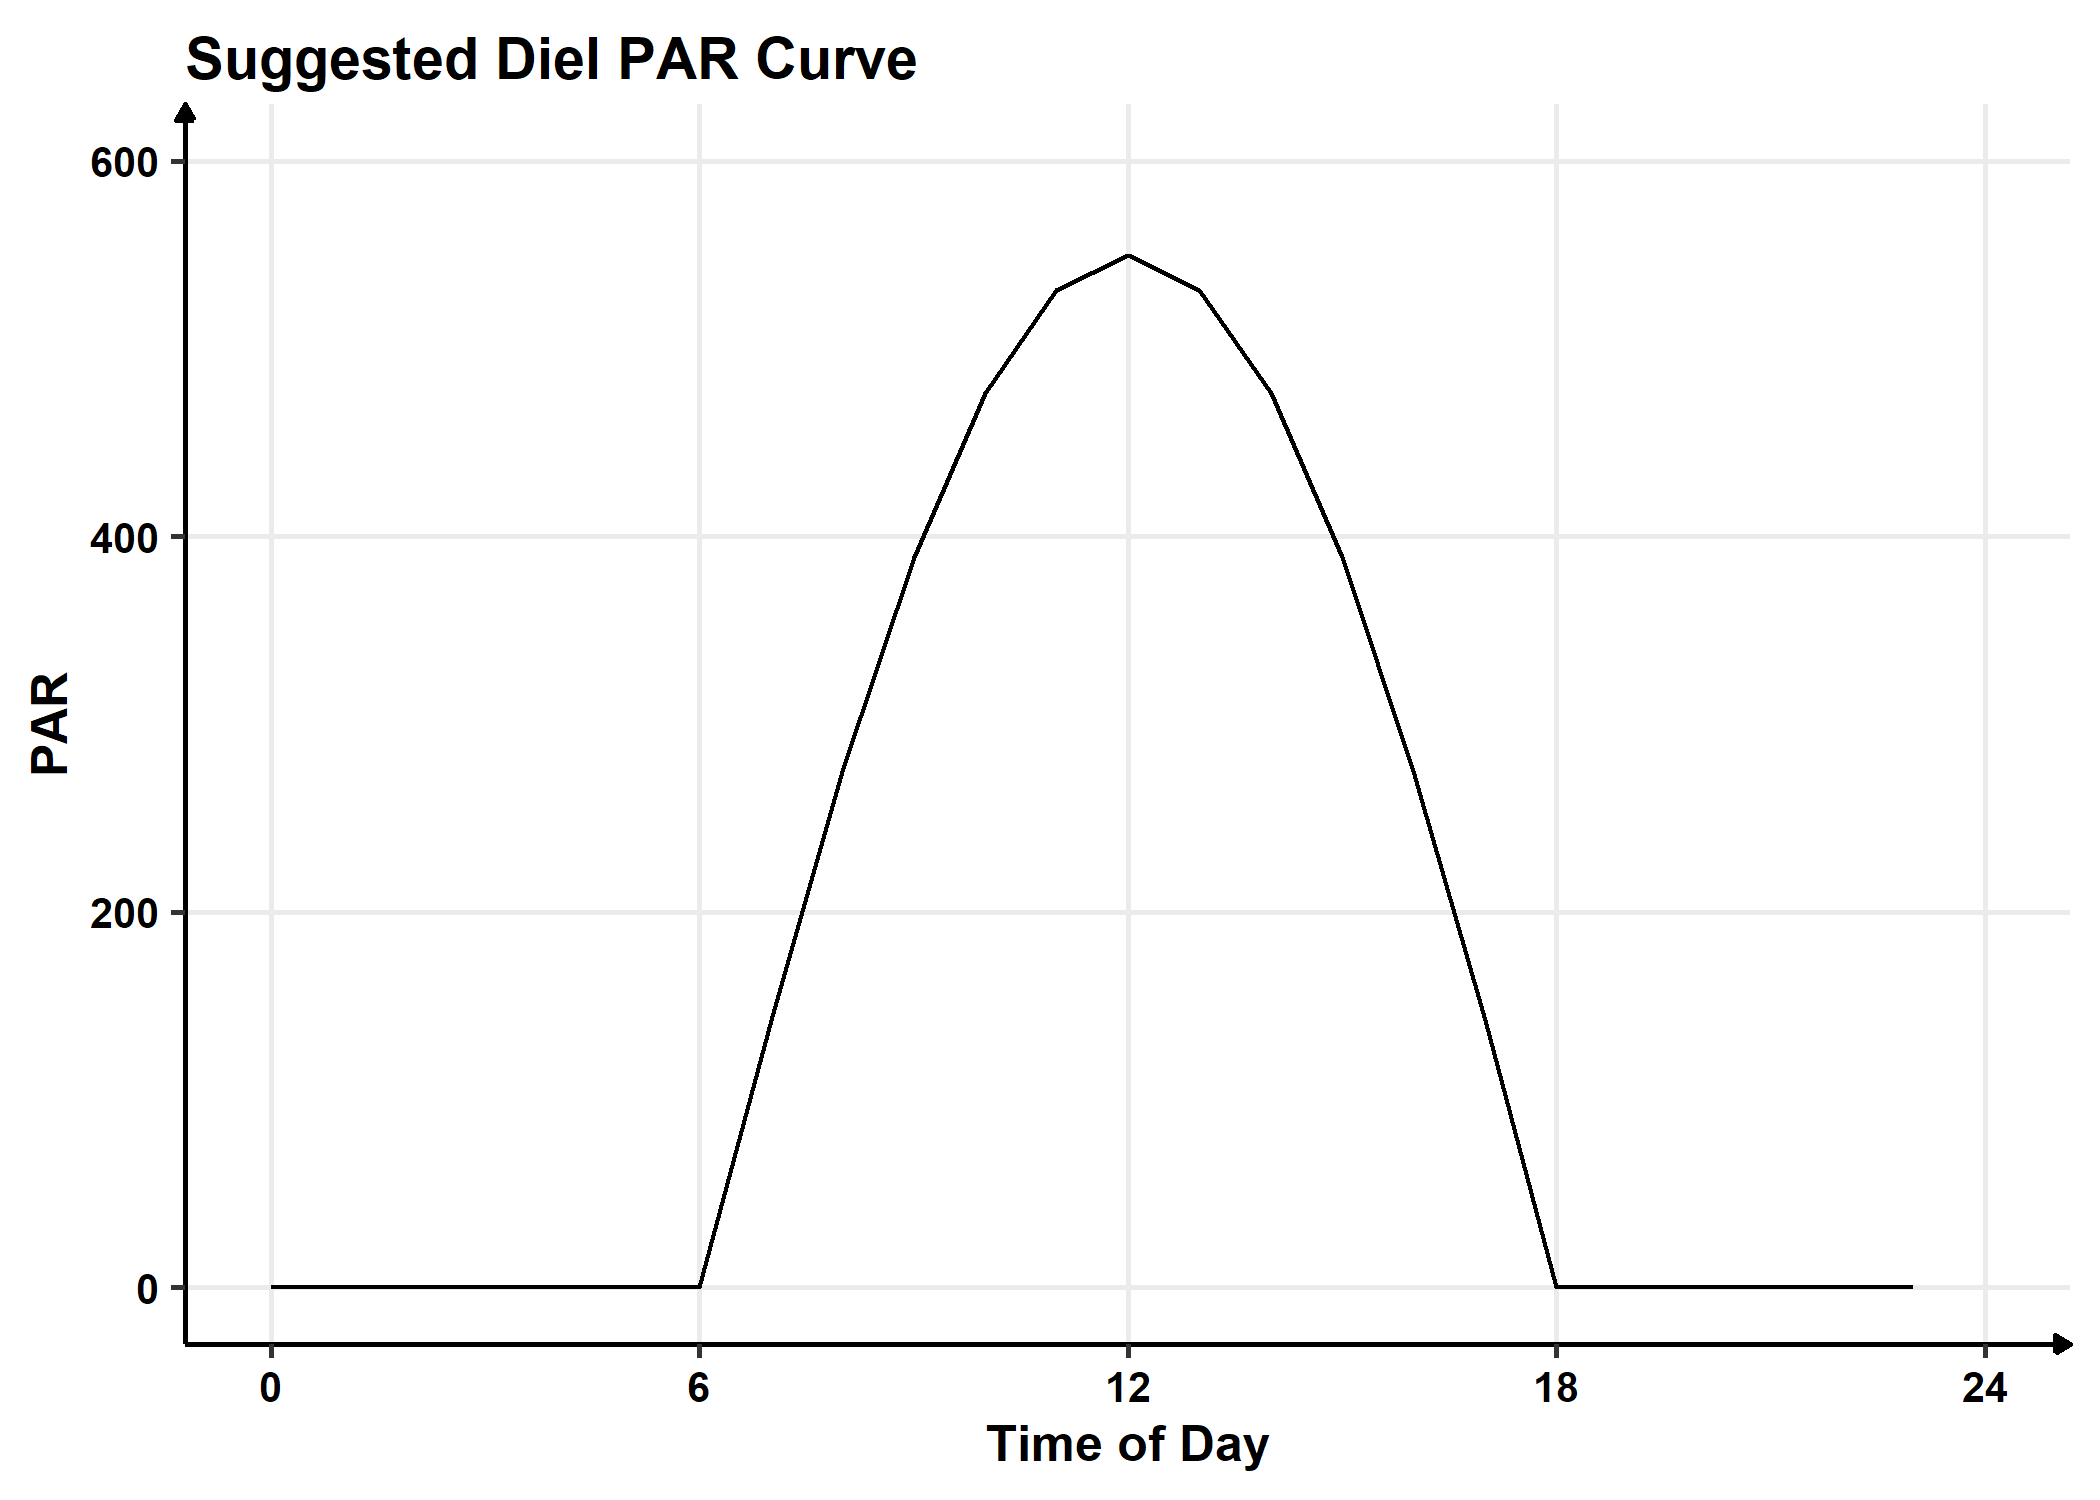
Finally, we can change how the light changes throughout the day. Currently we have been using 4 set points to create a rhombus shaped curve with a 3 hour linear ramp of sunrise and sunset and a linear hold at maximum PAR for 6 hours. In the user template window, there is a tool to help create setpoints to mimic a sine or parabolic curve which more closely follows natural lighting regimes.
Data to Inform Settings
Since most of the organisms we analyze in the lab come from reefs around Miami, I will use this data to inform the set points we choose.
Sun Rise and Set Times
Sunrise and sunset data comes from NOAA’s Global Monitoring Laboratory set at the coordinates for the Key Biscayne UM Nursery (25.676,-80.110).
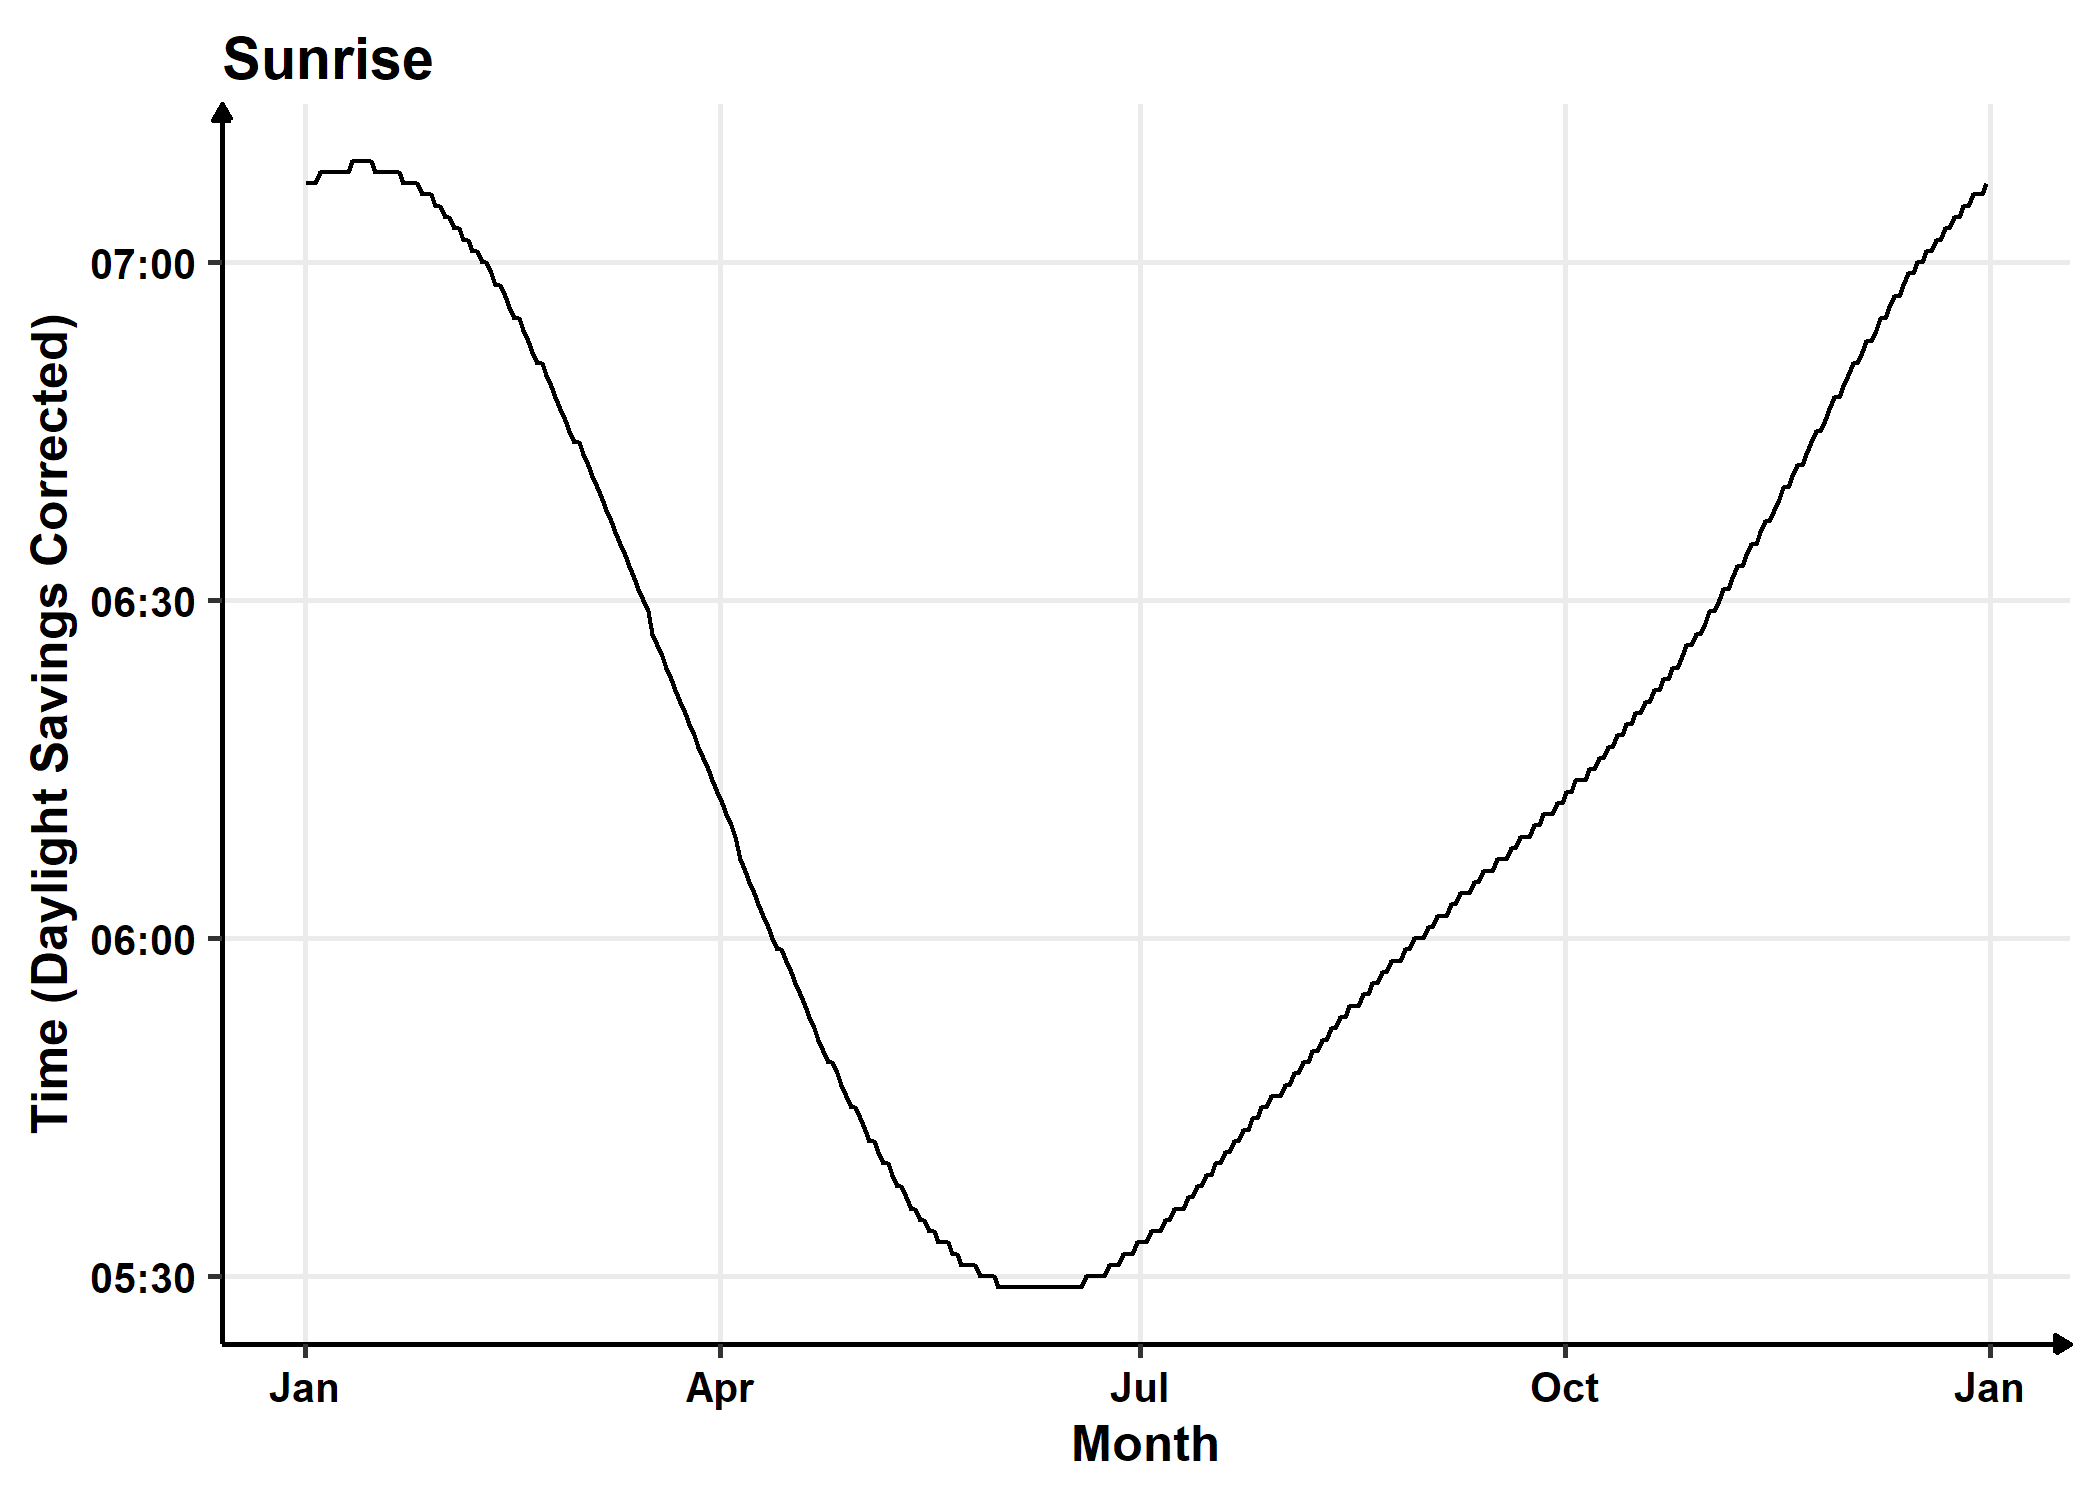
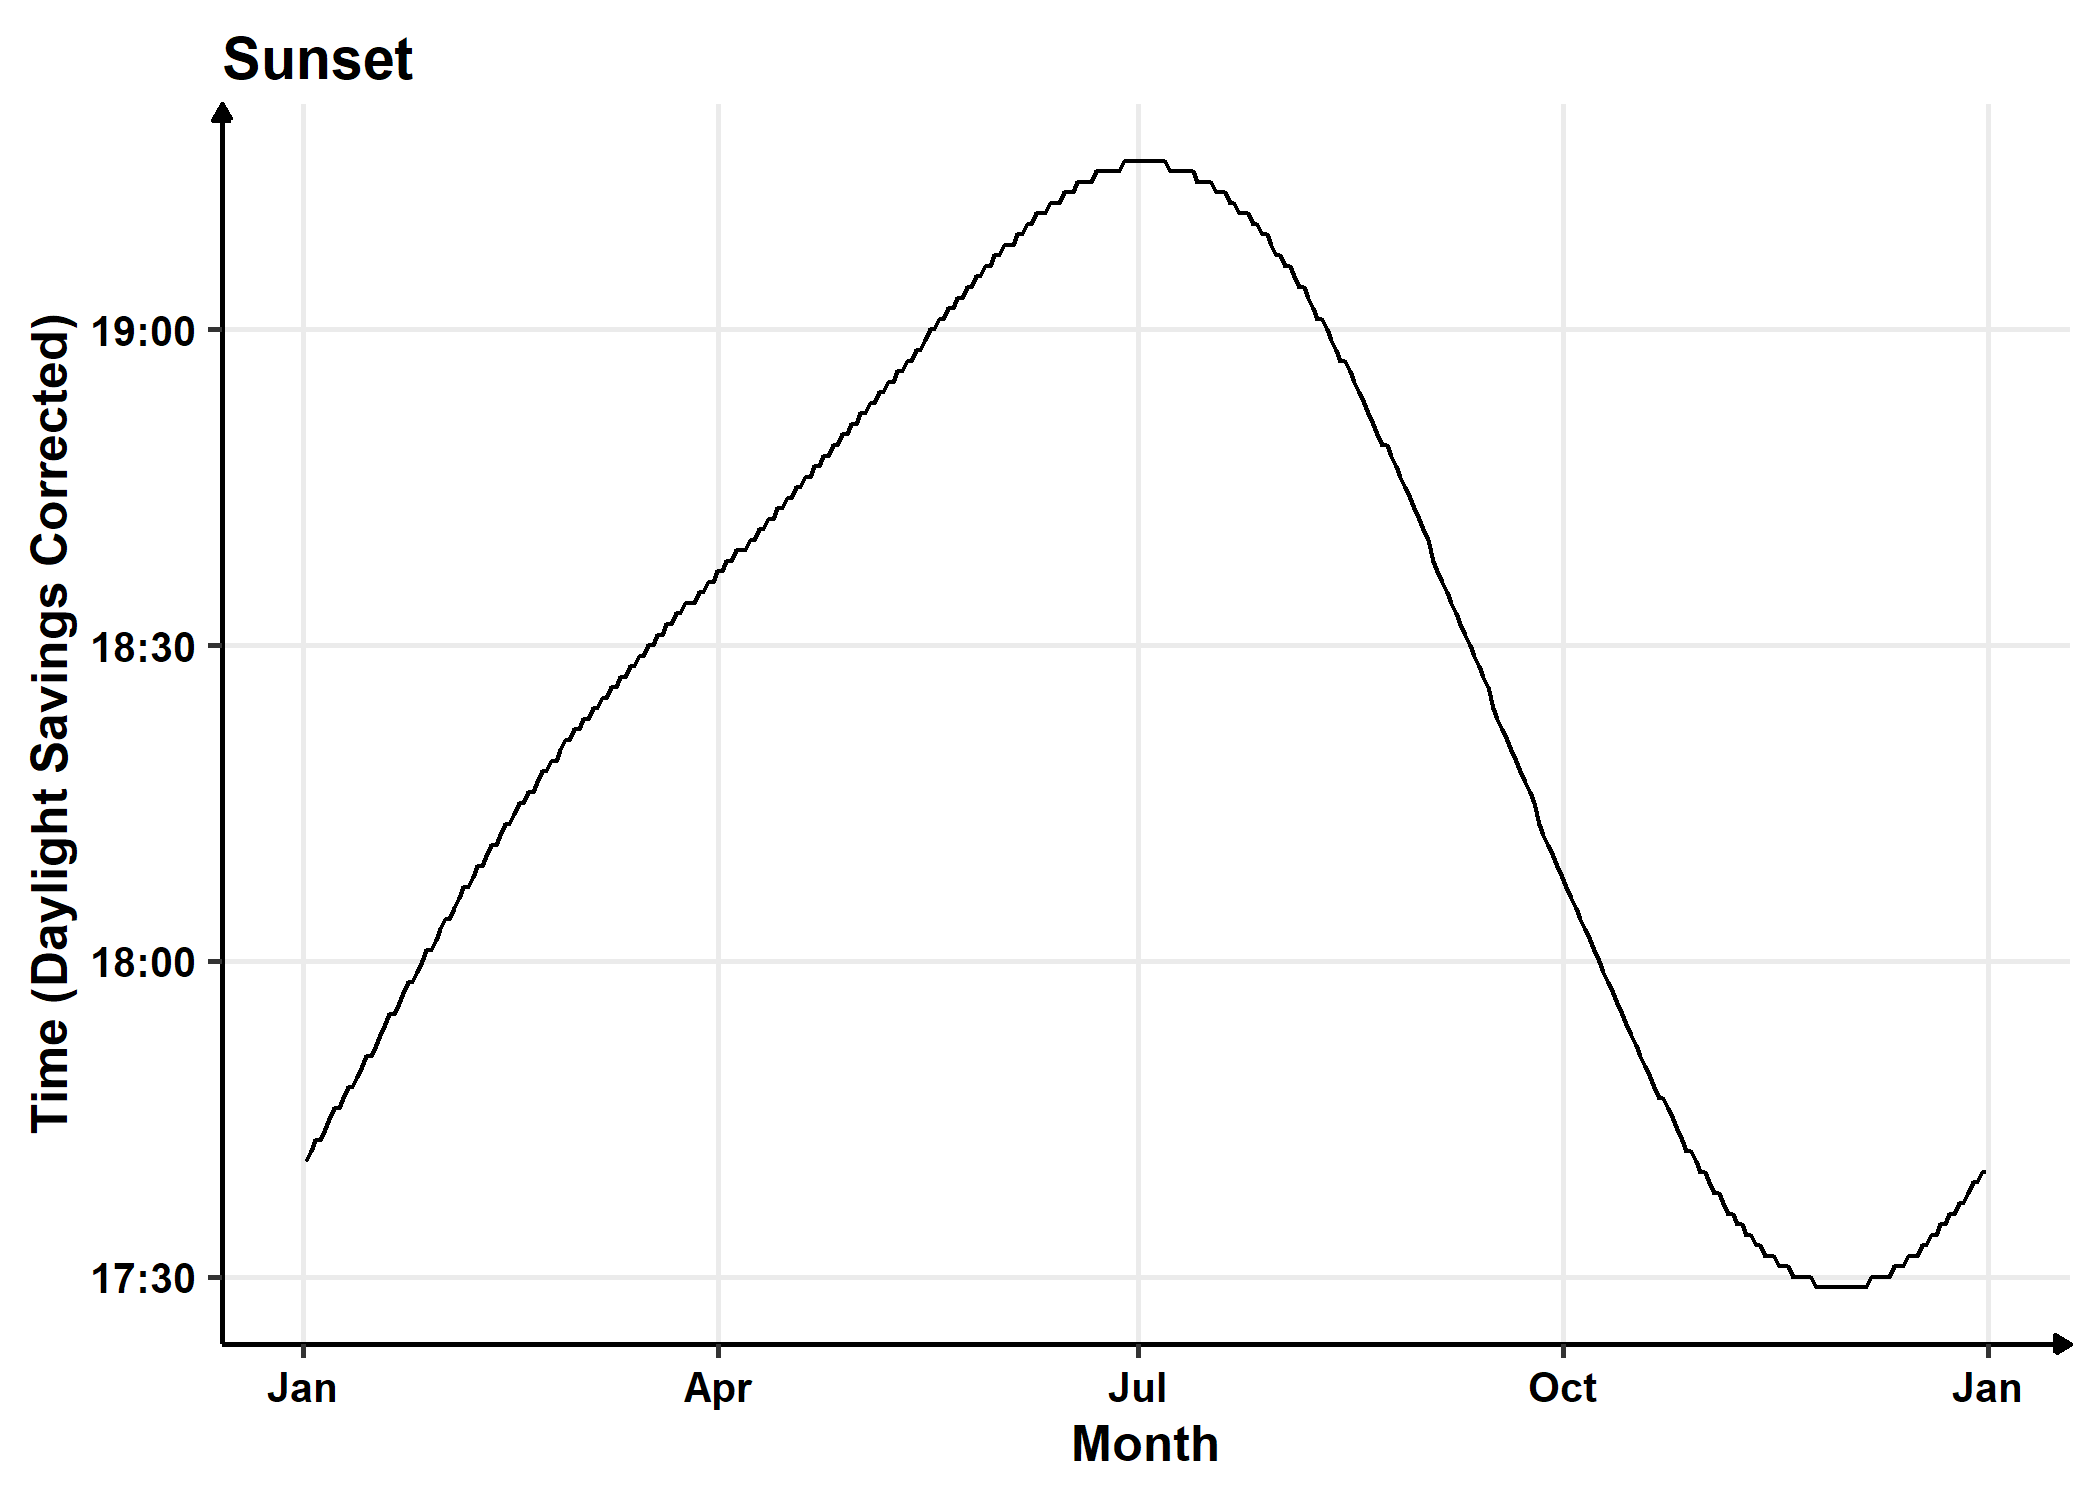
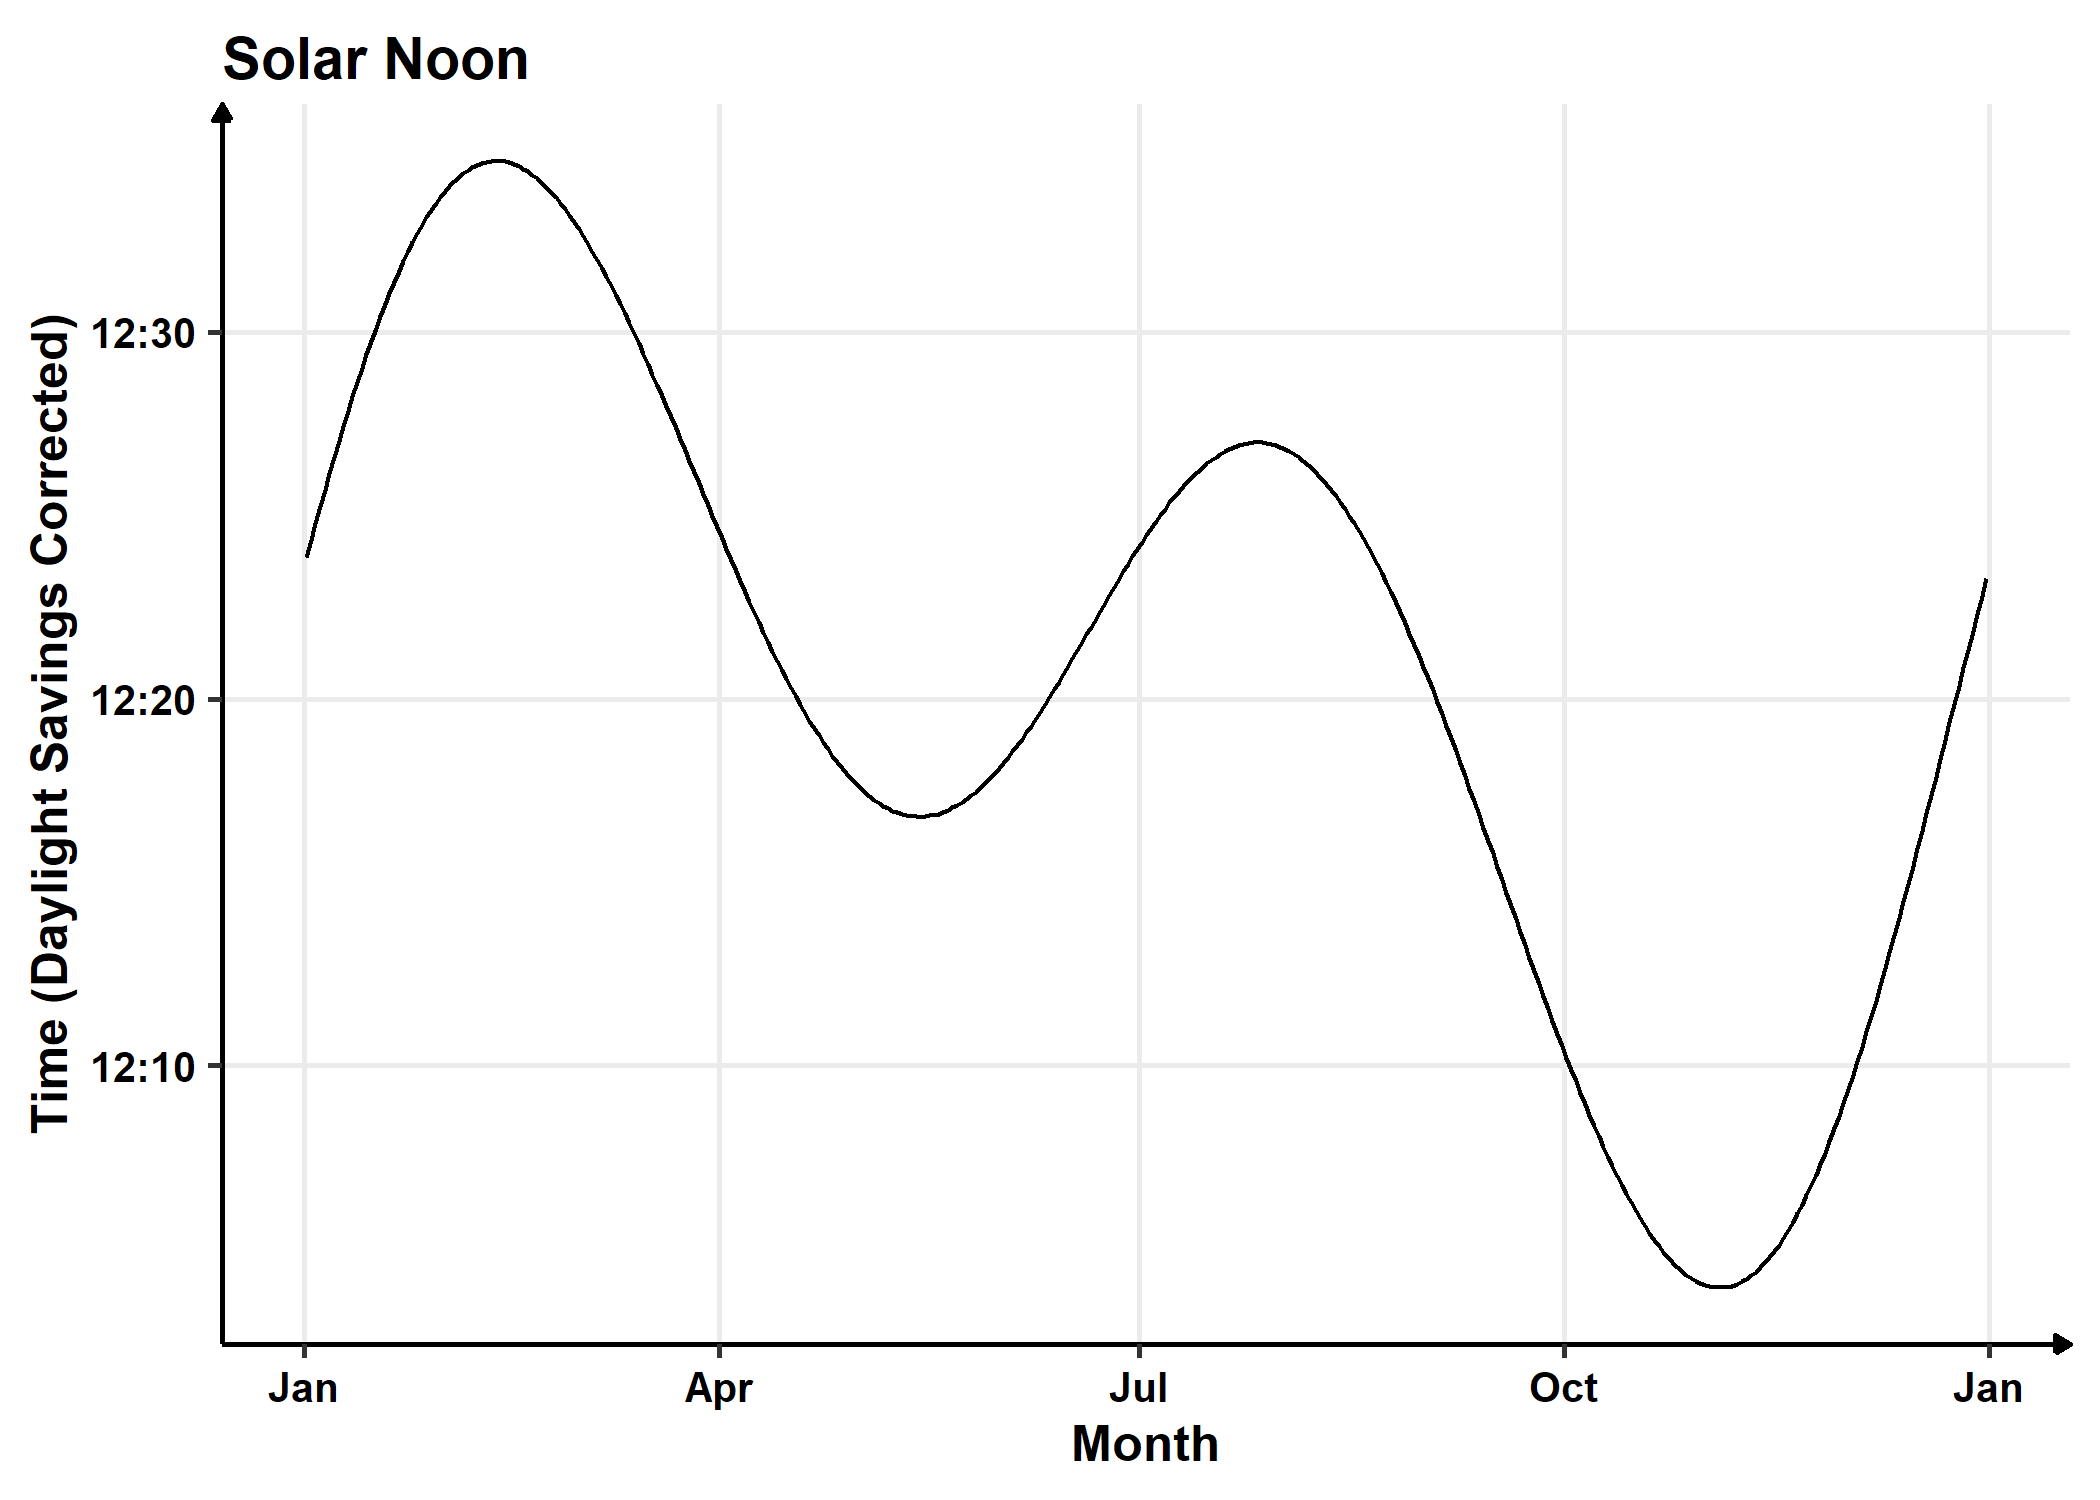
From this data, we can extract daily setpoints to upload to the Insolation table. We are unable to control solar noon with the current Insolation tool. However, this has a narrow range and is arguably less critical than other setpoints.
Moon Rise and Set Times
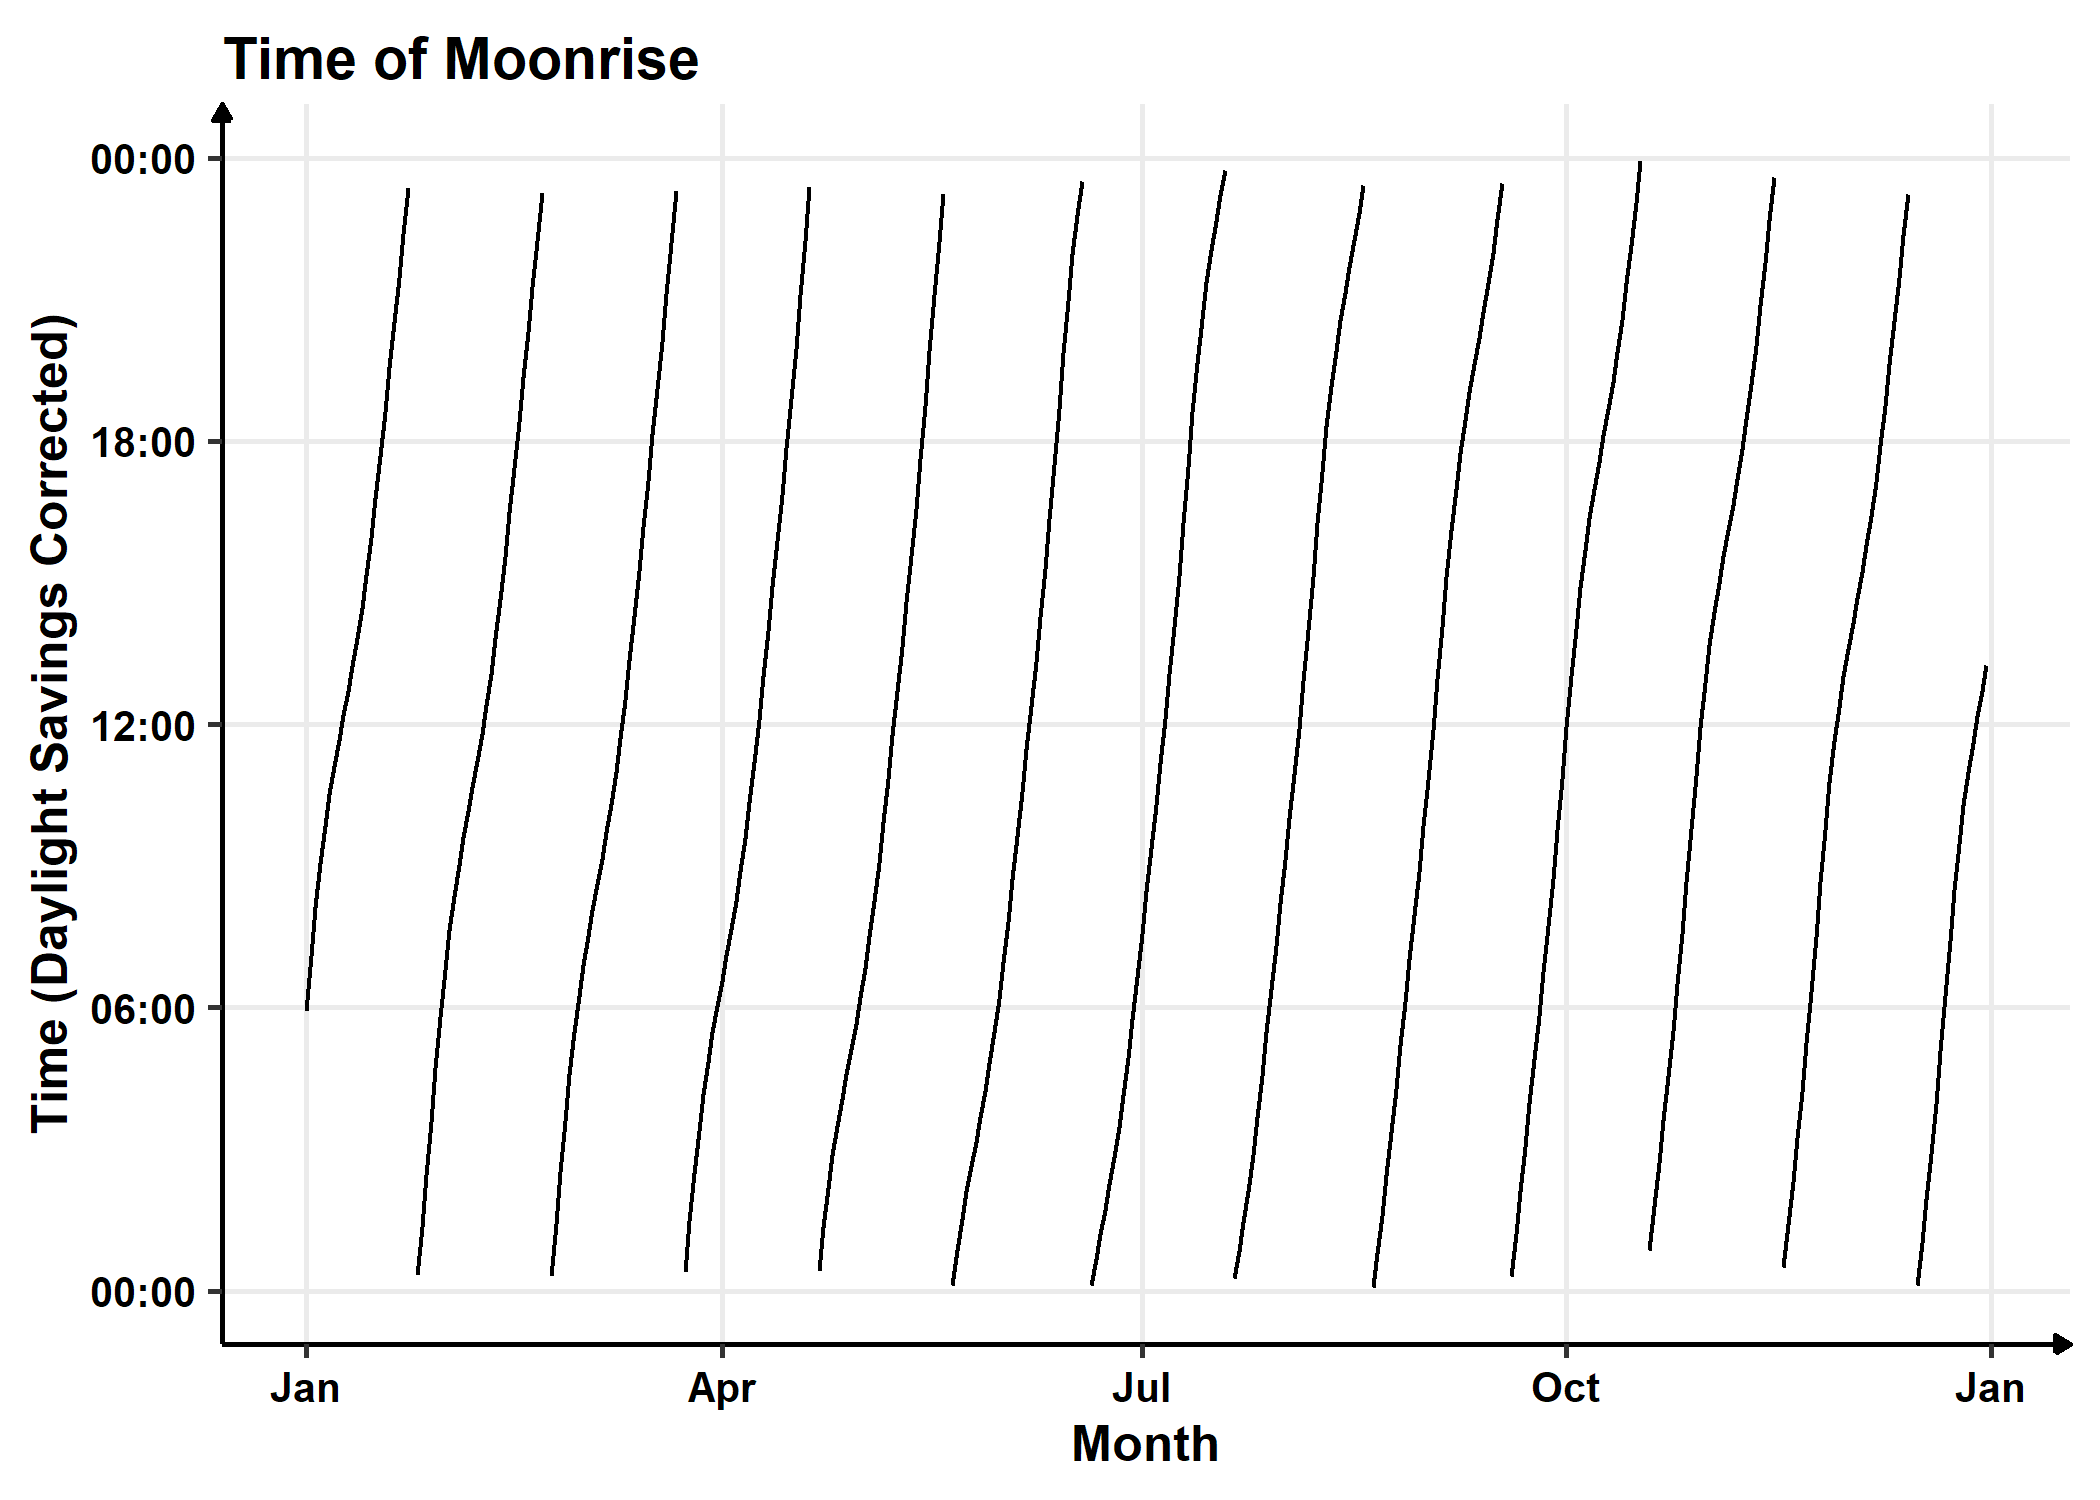
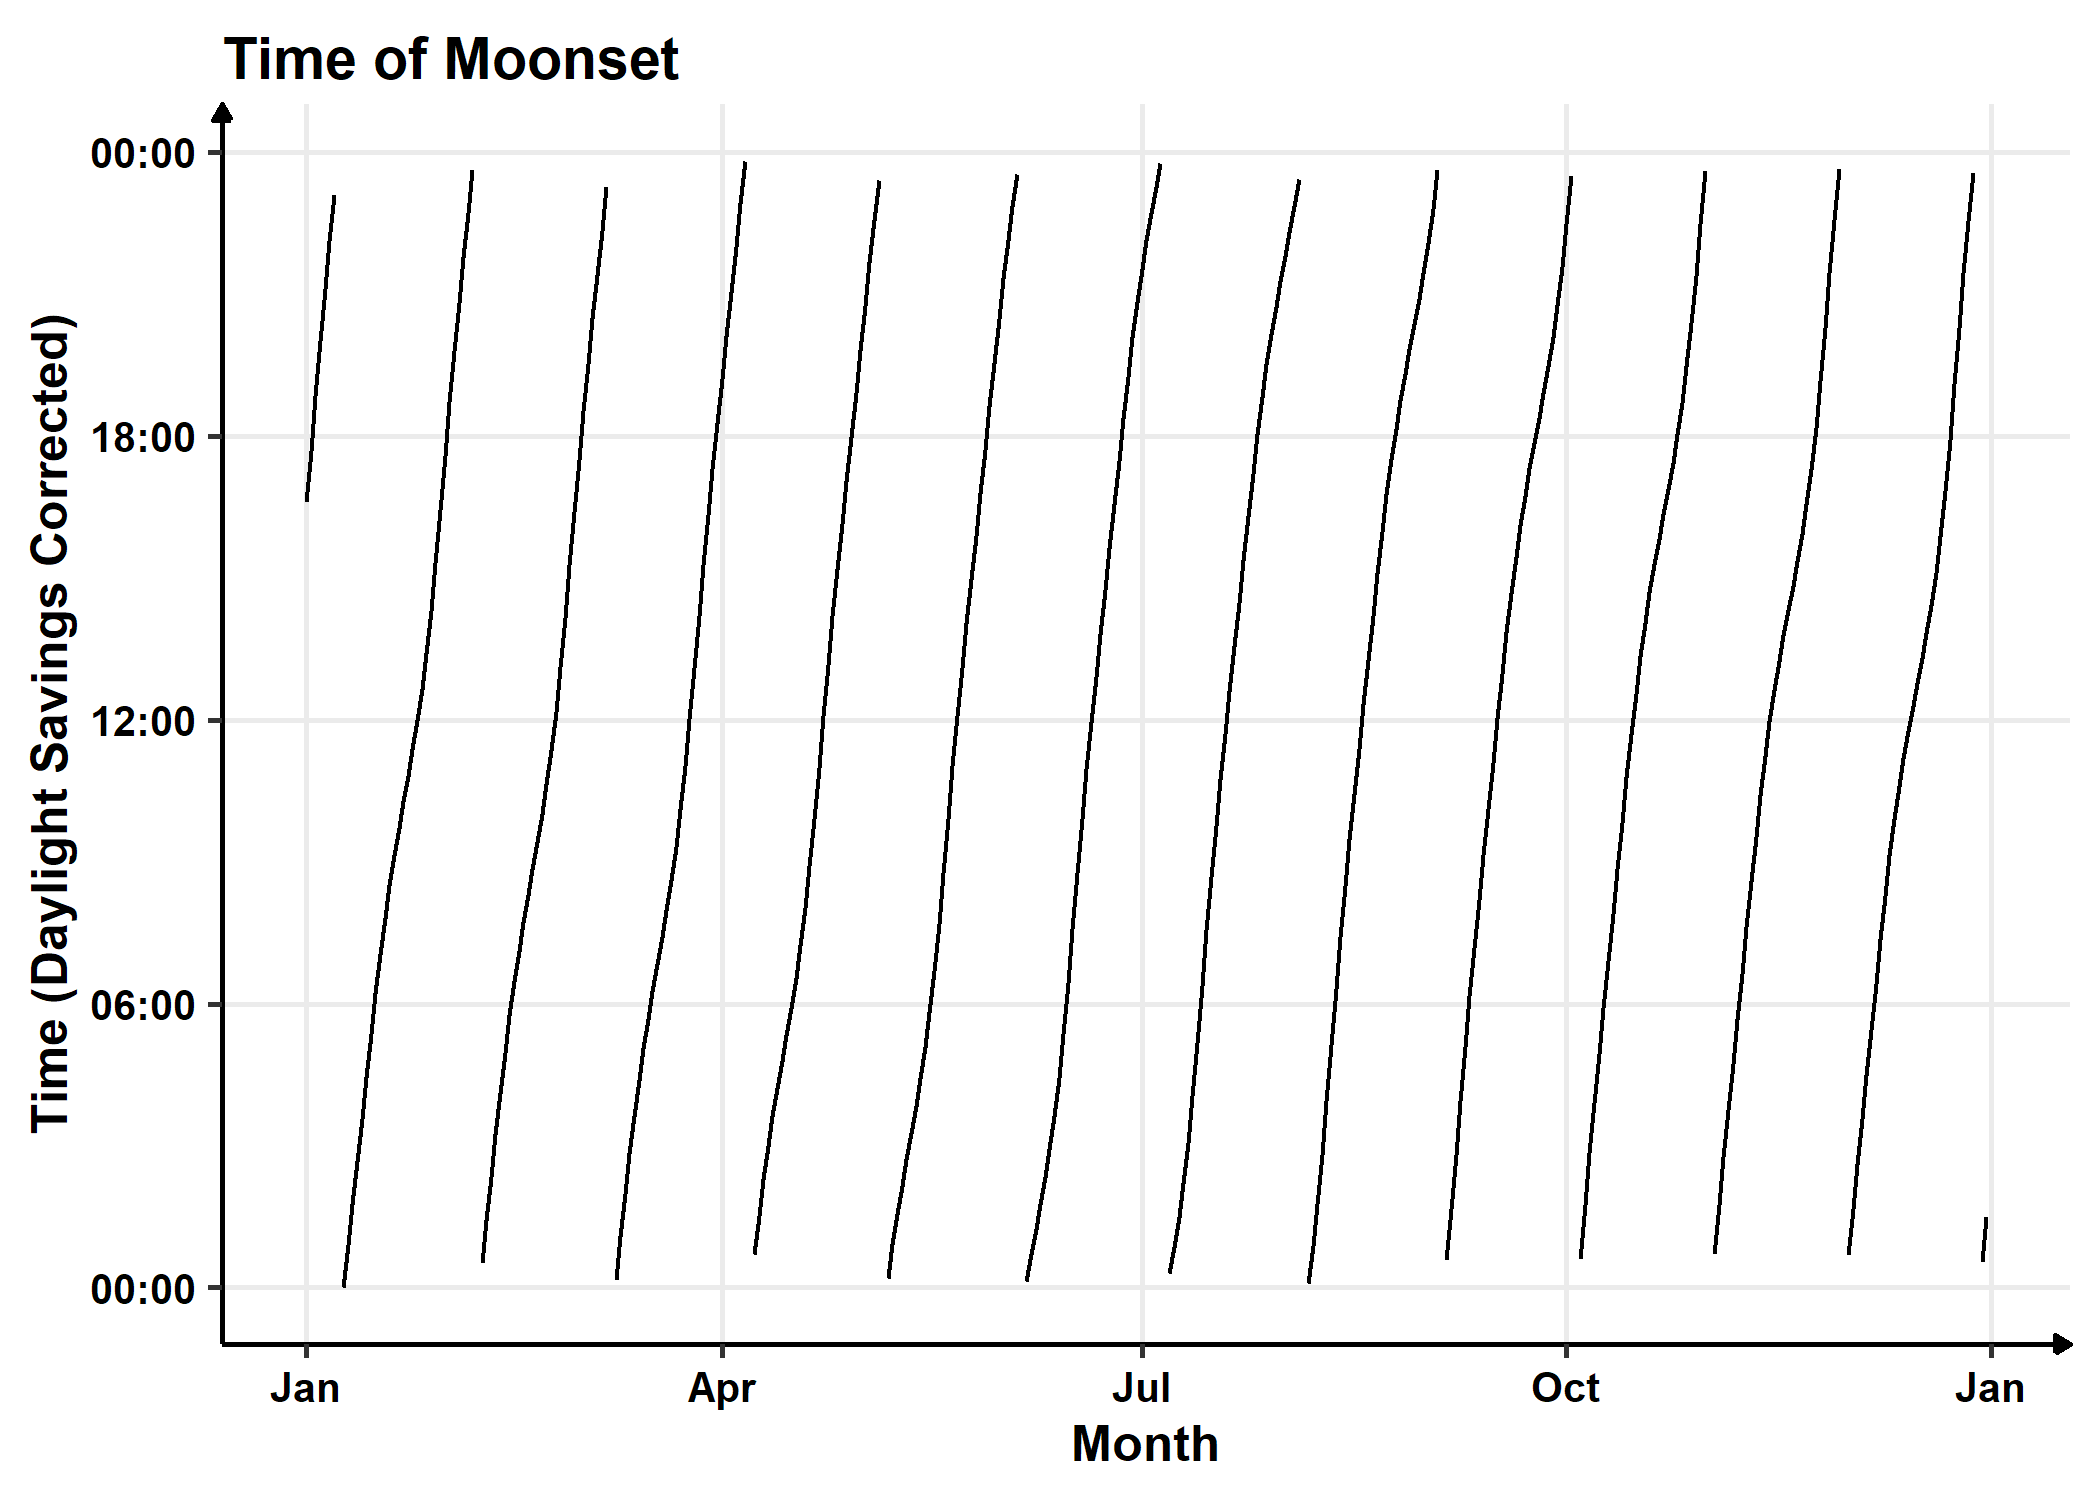
Moonrise and Moonset are defined as times when the moon passes through the horizon which changes with the phases. Data was collected from the US Naval Observatory’s Astronomical Applications Department API.
Since the light provided by the moon is better modeled as a percentage of brightness supplied by the full moon (rise at sunset and set at sunrise), the precise timing of the moonrise and moonset does not matter. Rather, changing the brightness on a schedule that tracks the lunar phases is prudent with 0% occuring at a New Moon and 100% at a full moon. I just think this data is cool.
Solar Intensity
To map out the intensities we want to simulate in our aquariums, I am looking at a few different datasets collected in situ at a coral nursery in Miami, a long term C-MAN buoy in the Florida Keys, and satellite data.
Nursery PAR Data
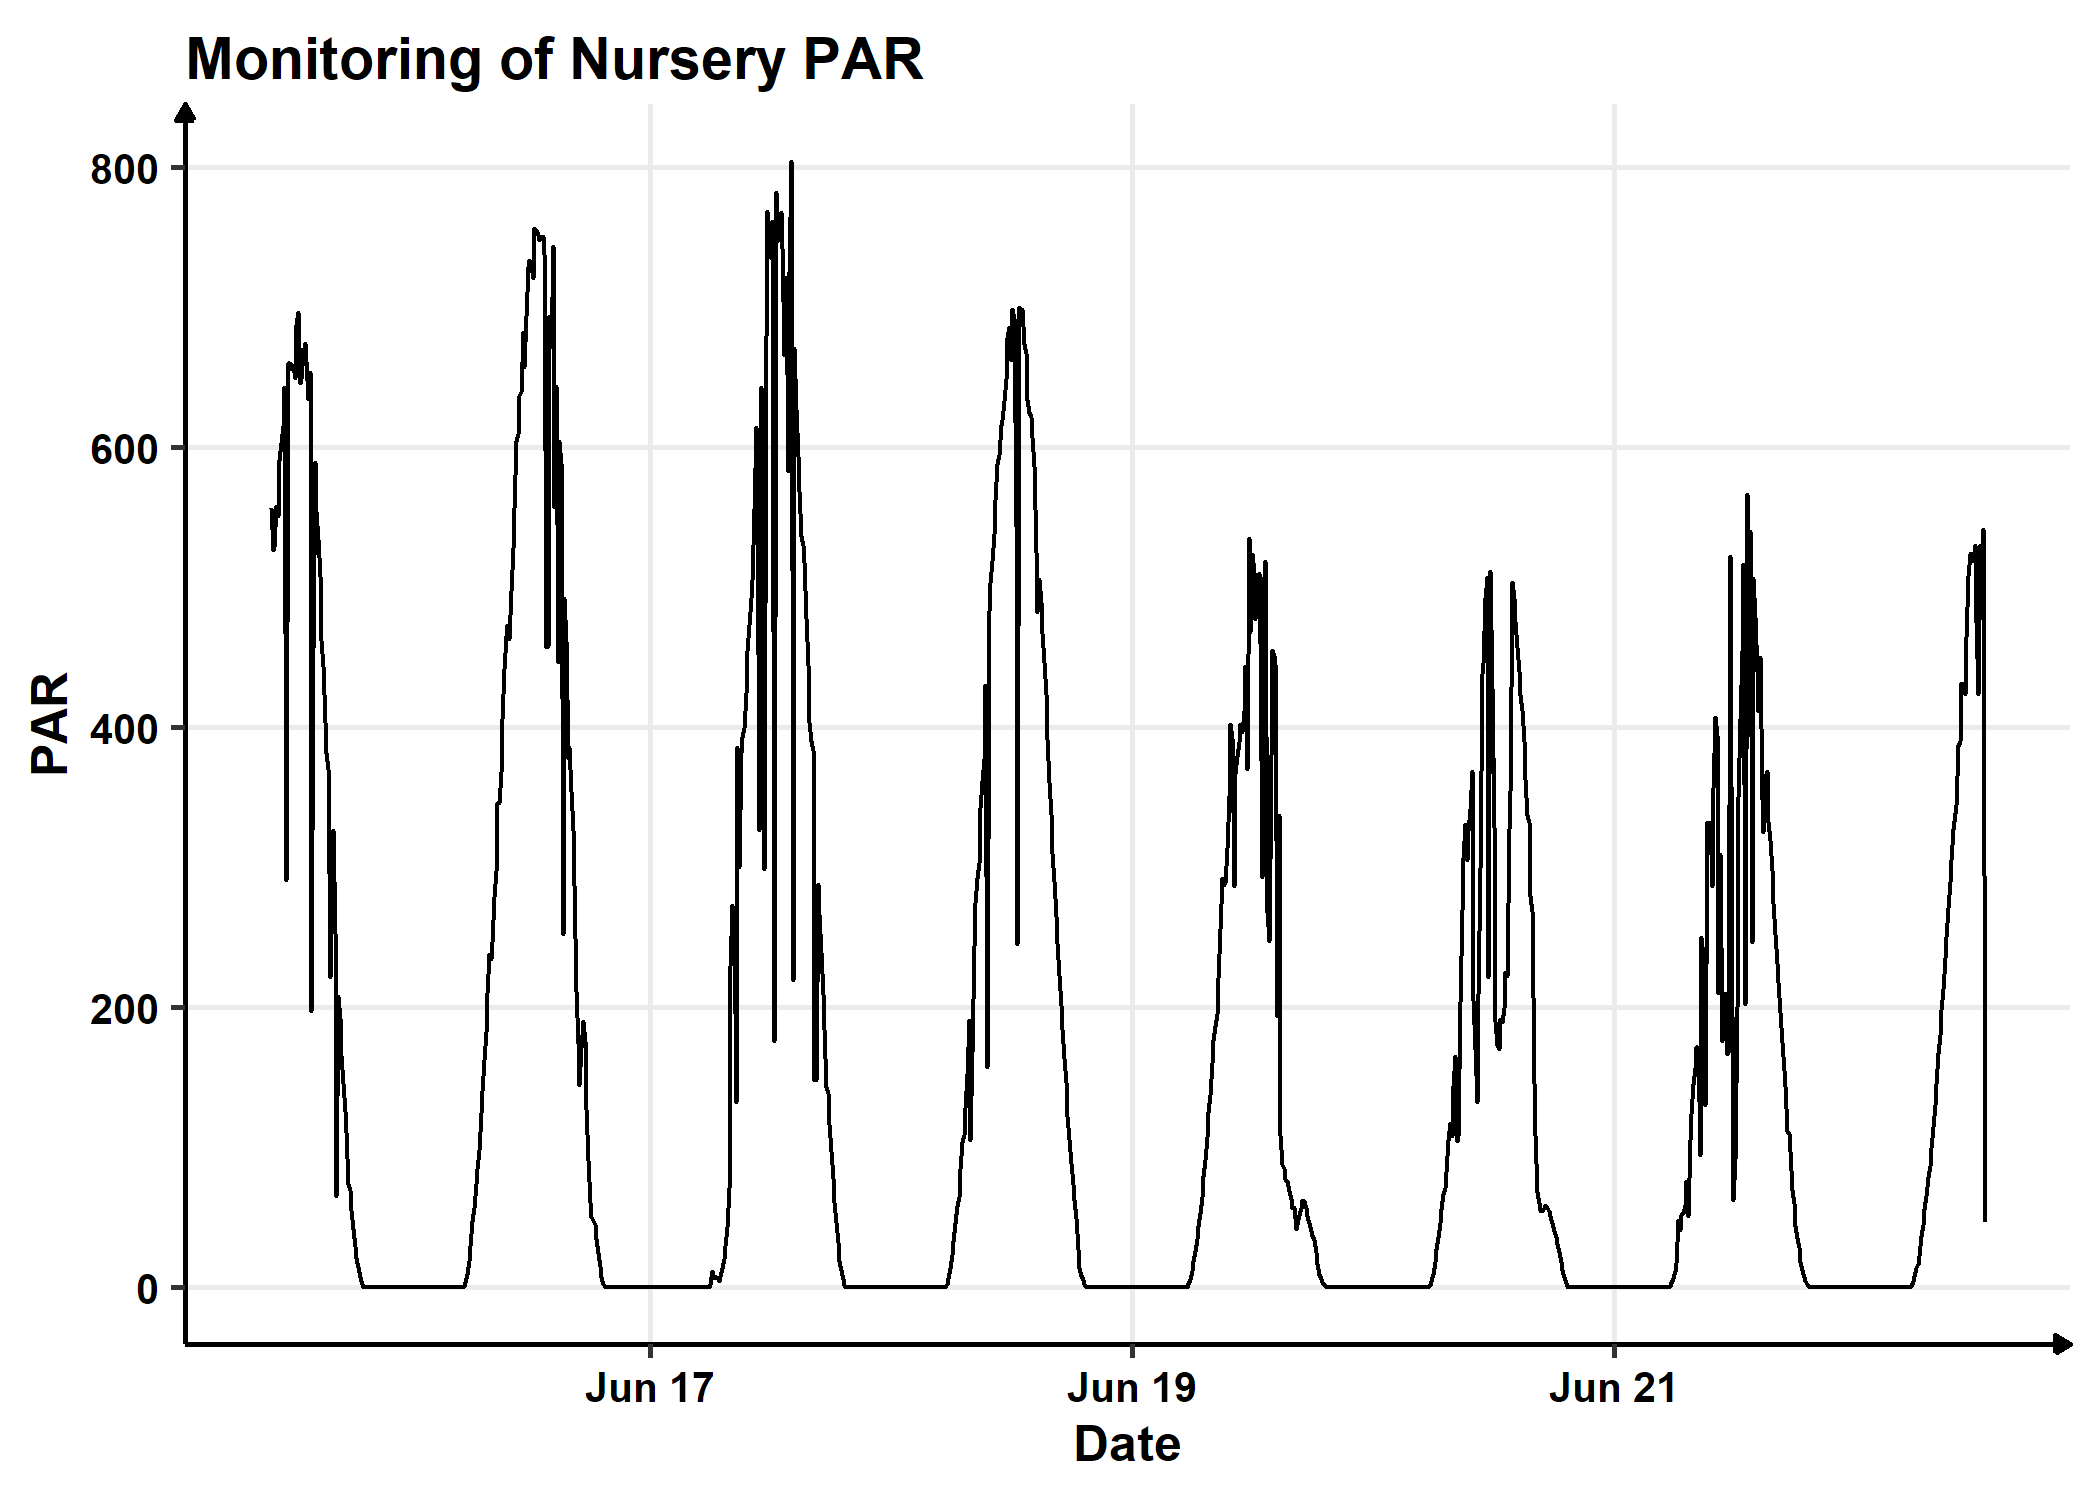
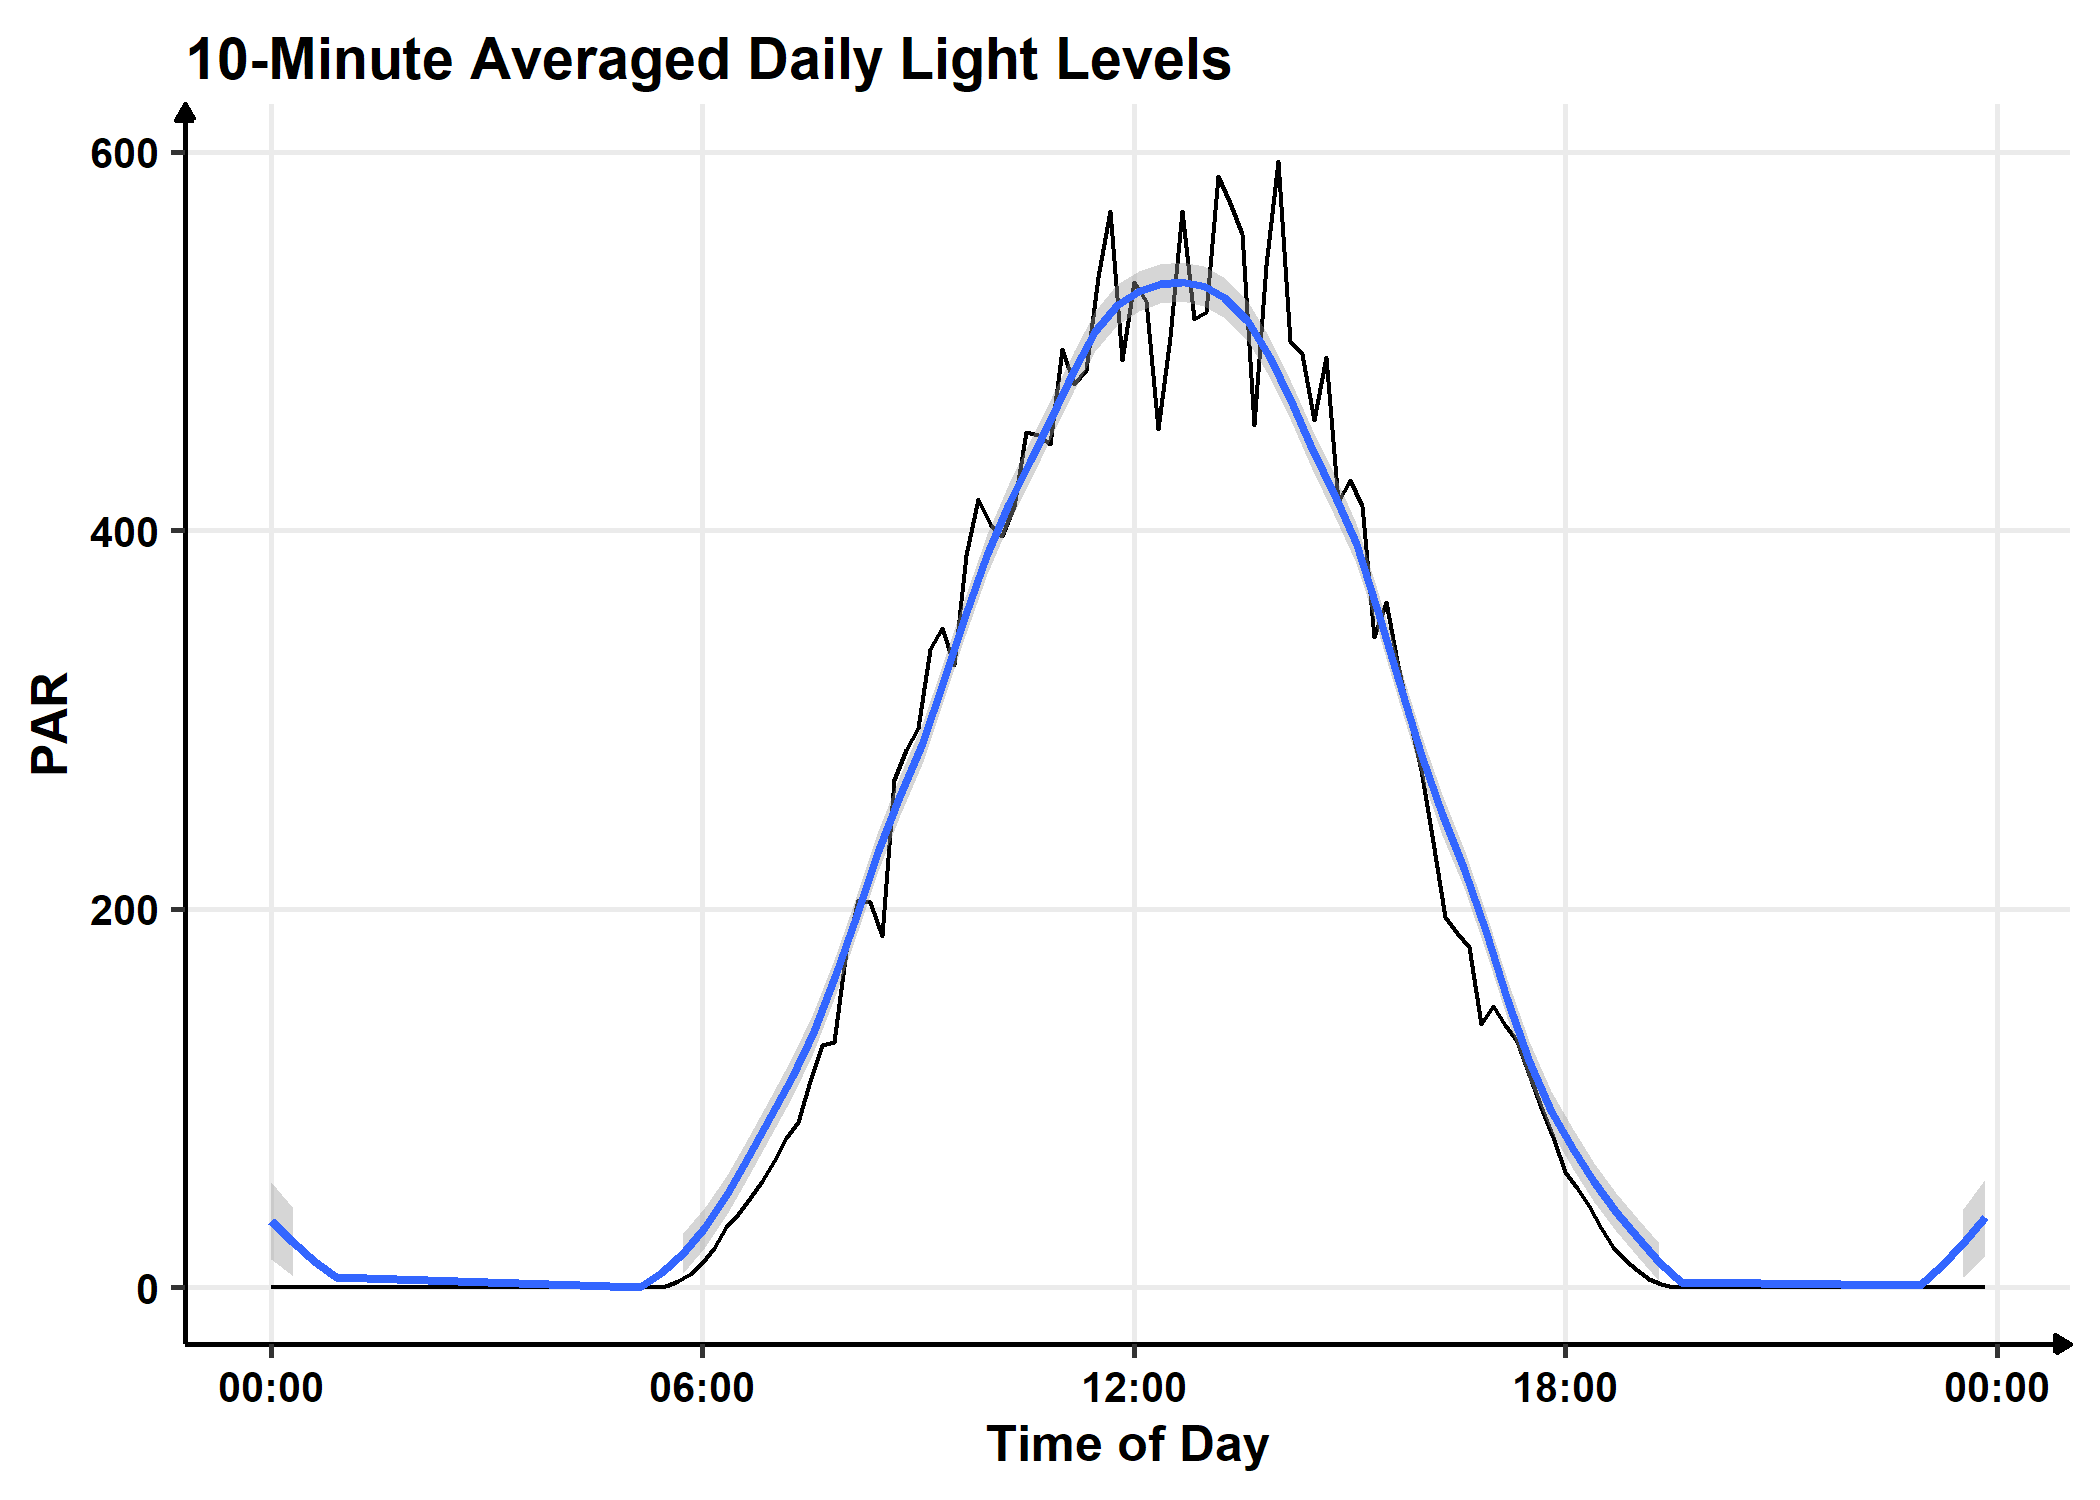
PAR data collected by Morgan Chakraborty and Nathan Formel. It most closely approximates a sine wave with a peak at solar noon. This data was also collected right around the summer solstice, giving us the peak of the seasonal light curve. From the smoothed data, our yearly peaked data is thus around 550 micromol m^-2 s^-1.
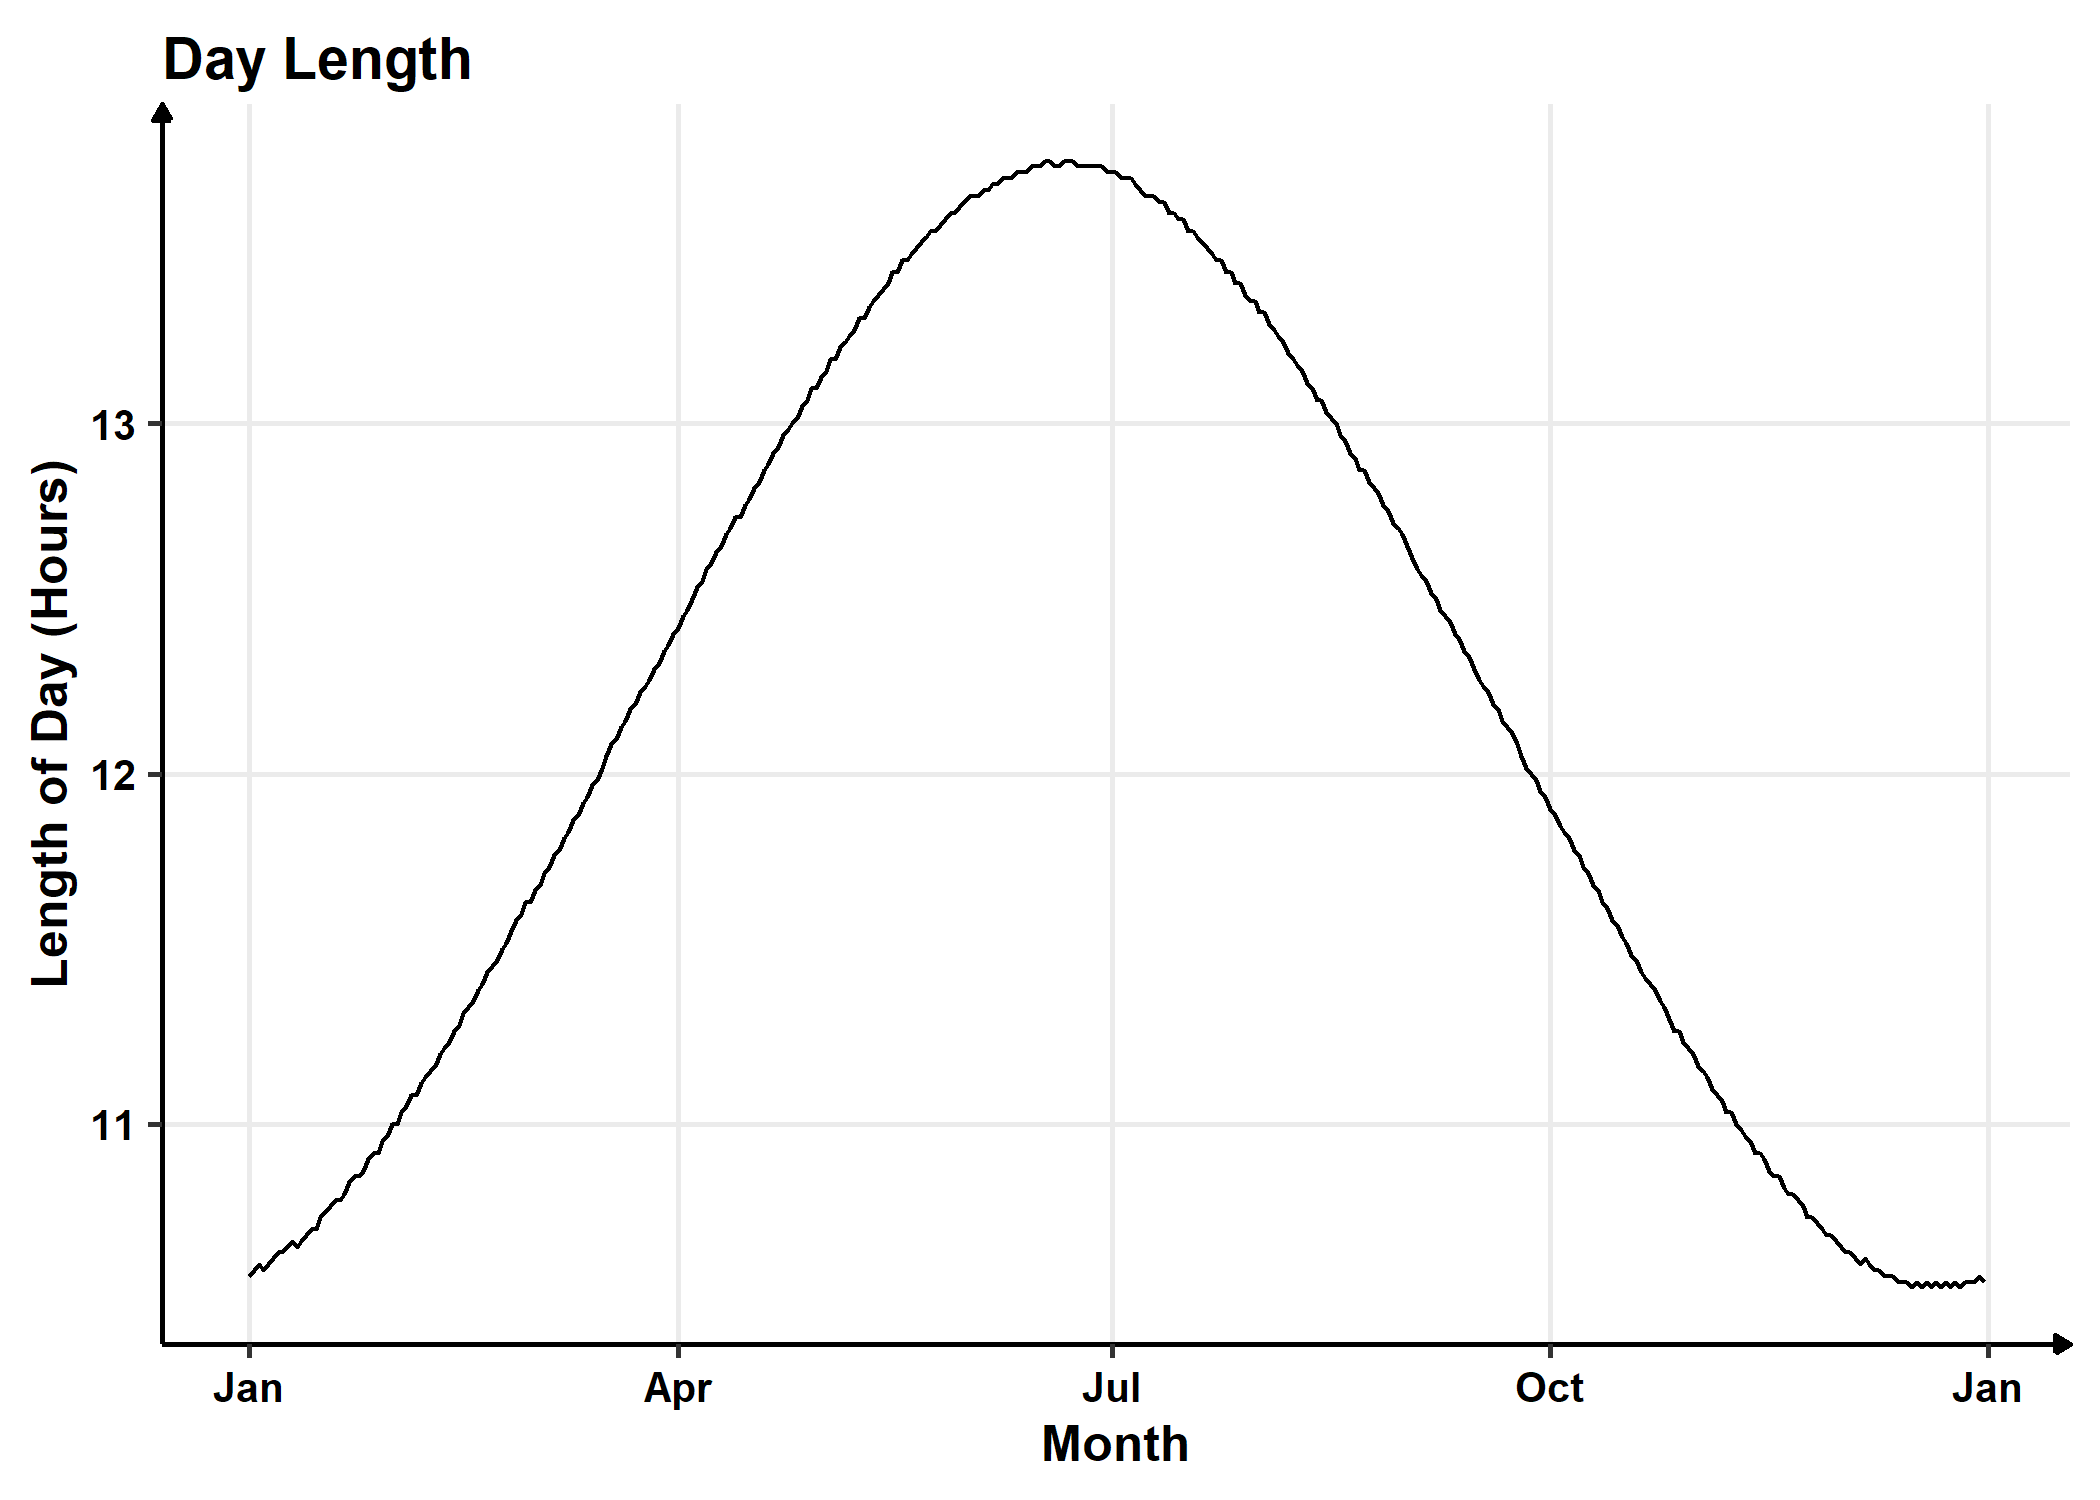
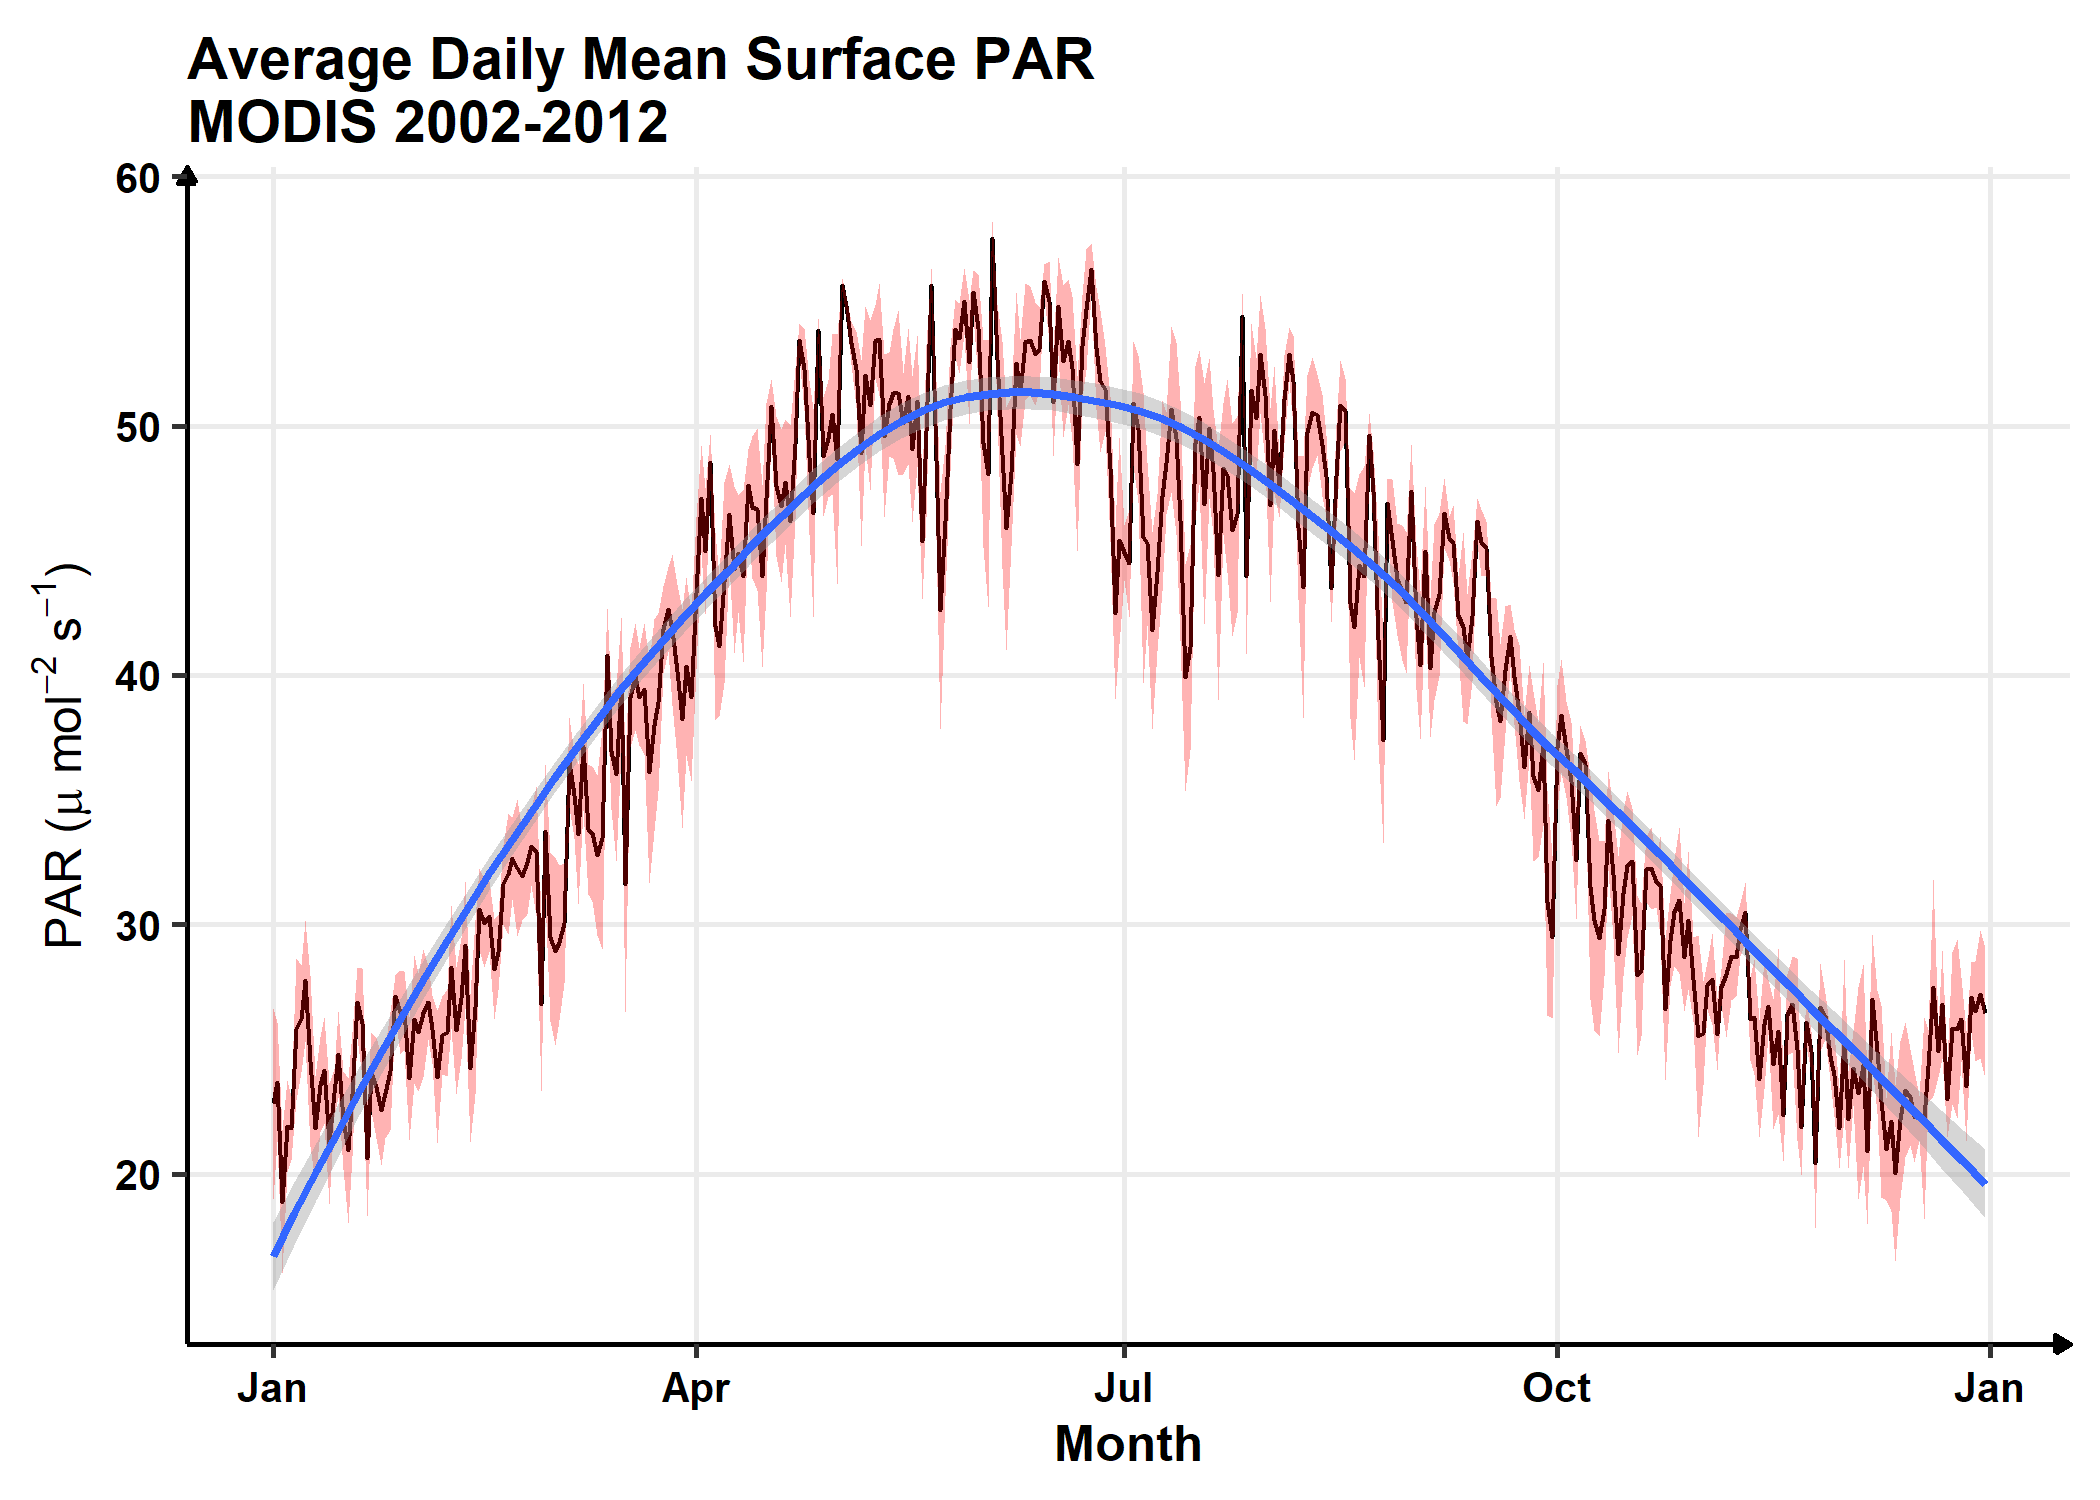
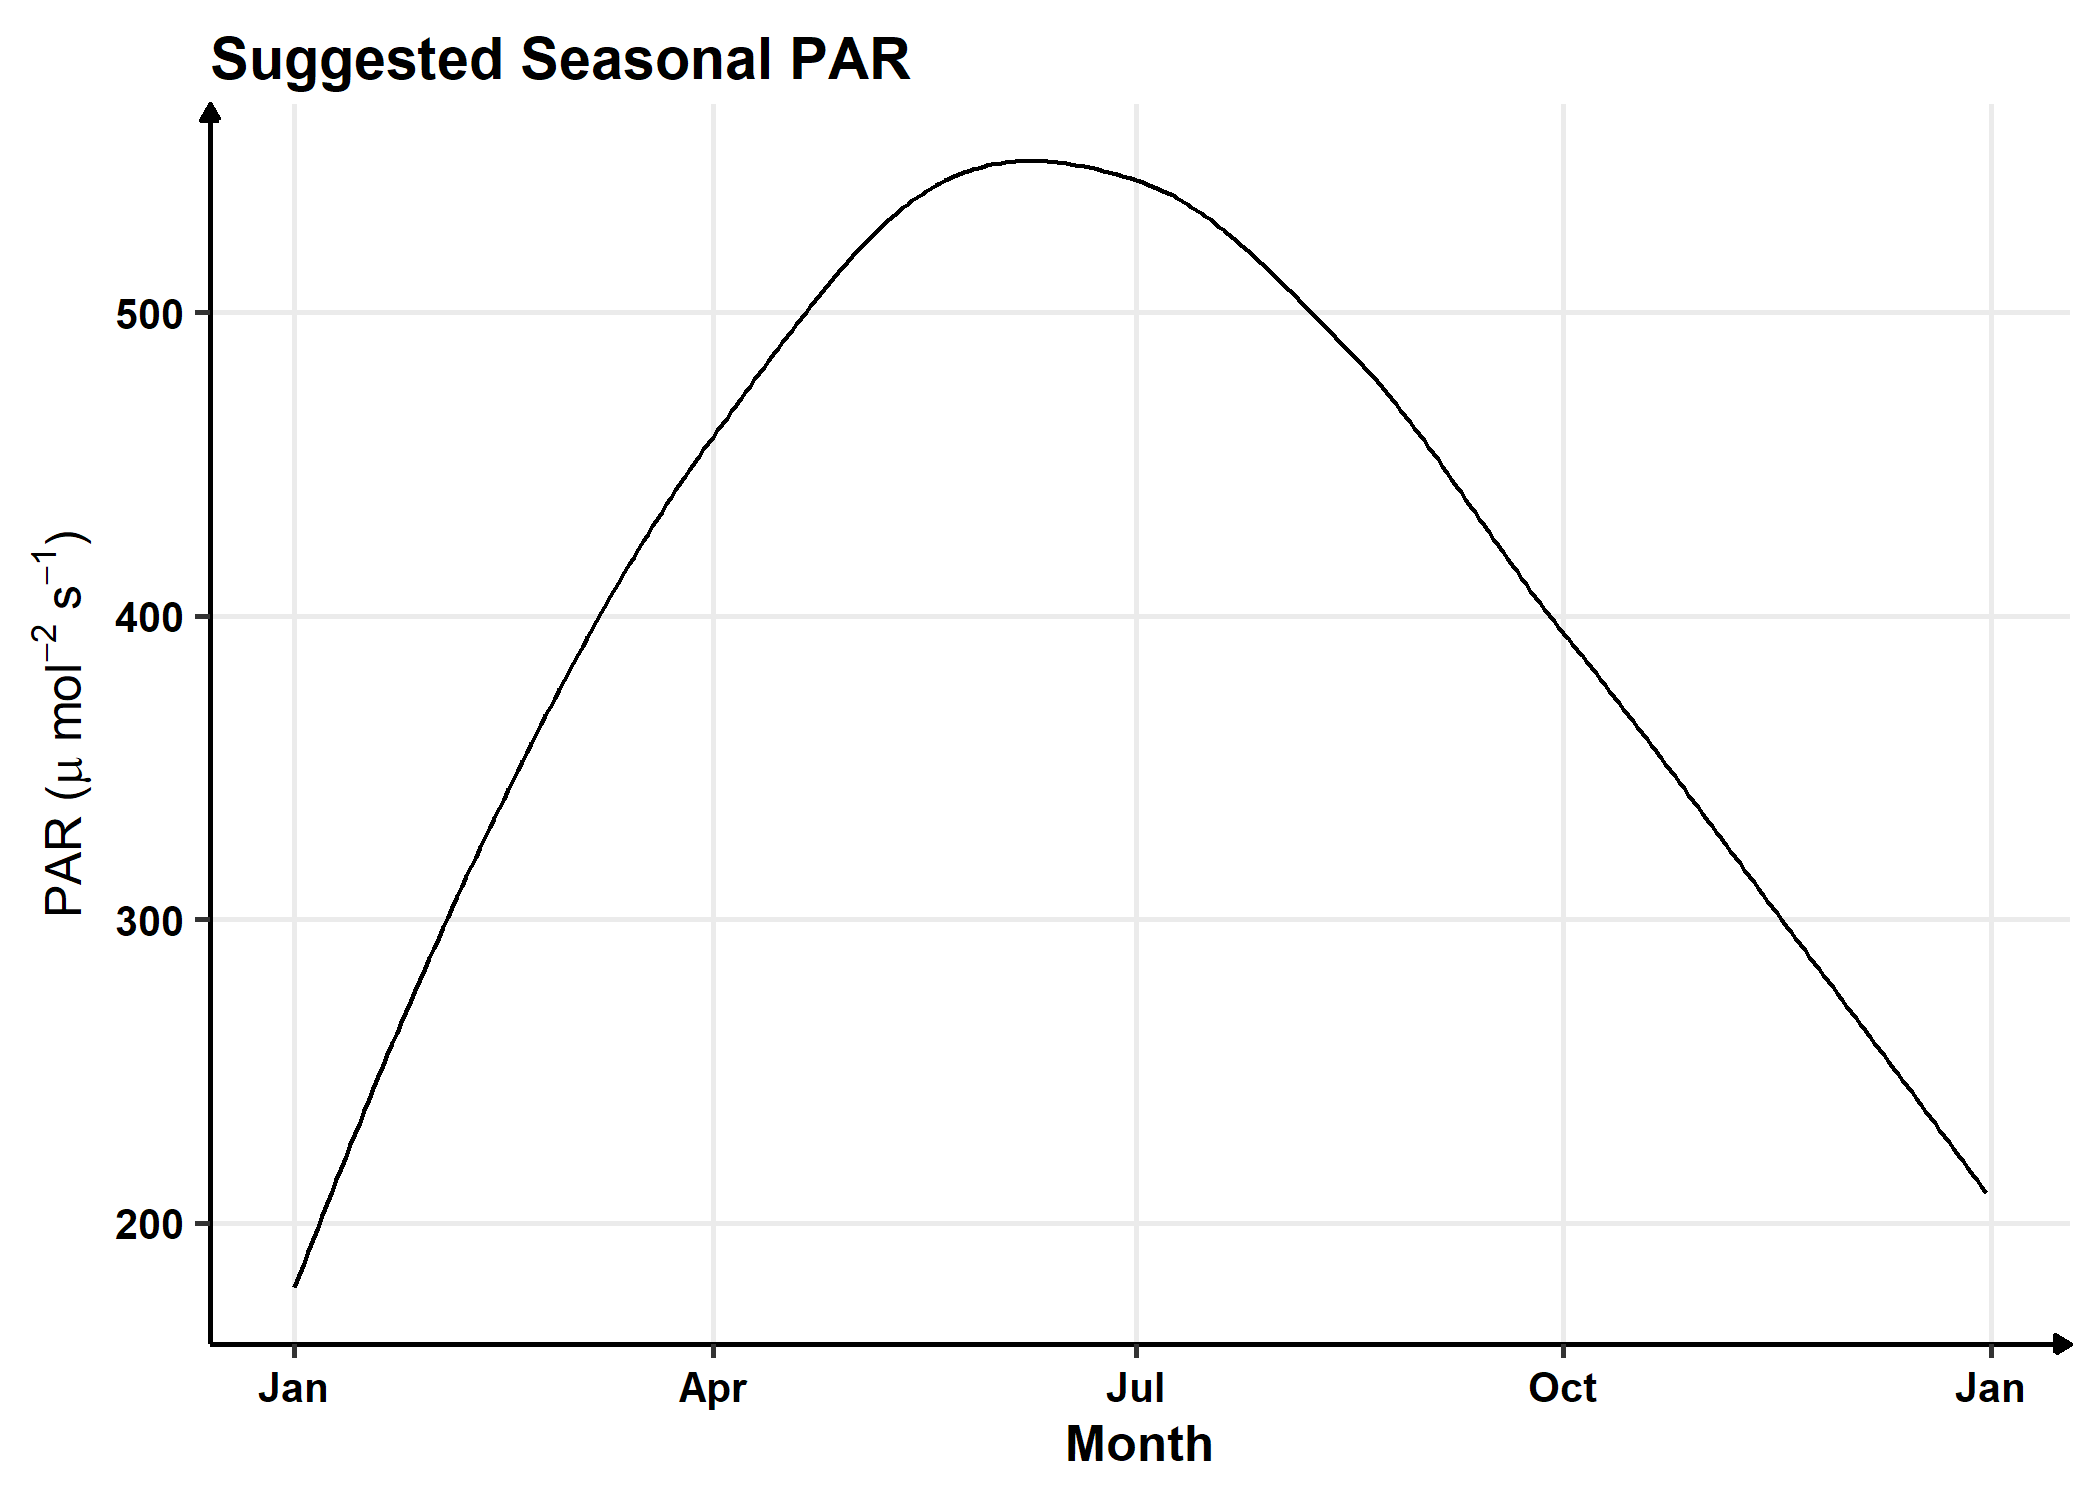
To investigate seasonal trends in light, I am using PAR data extracted from NASA’s MODIS Level-3 Data. This data is supplied as mean daily exposure (mol m^-2 day^-1 ) and has a 4km resolution. I extracted data from 2002 to 2012 and calculated a daily average to construct a seasonal light exposure plot. Assuming that the attenuation of light in a water column is constant throughout the year, then we can extract seasonal light exposure curves to aid in our construction of modeled light exposure for our experiments. The exact brightness, however, will be informed by PAR data collected in situ from above.
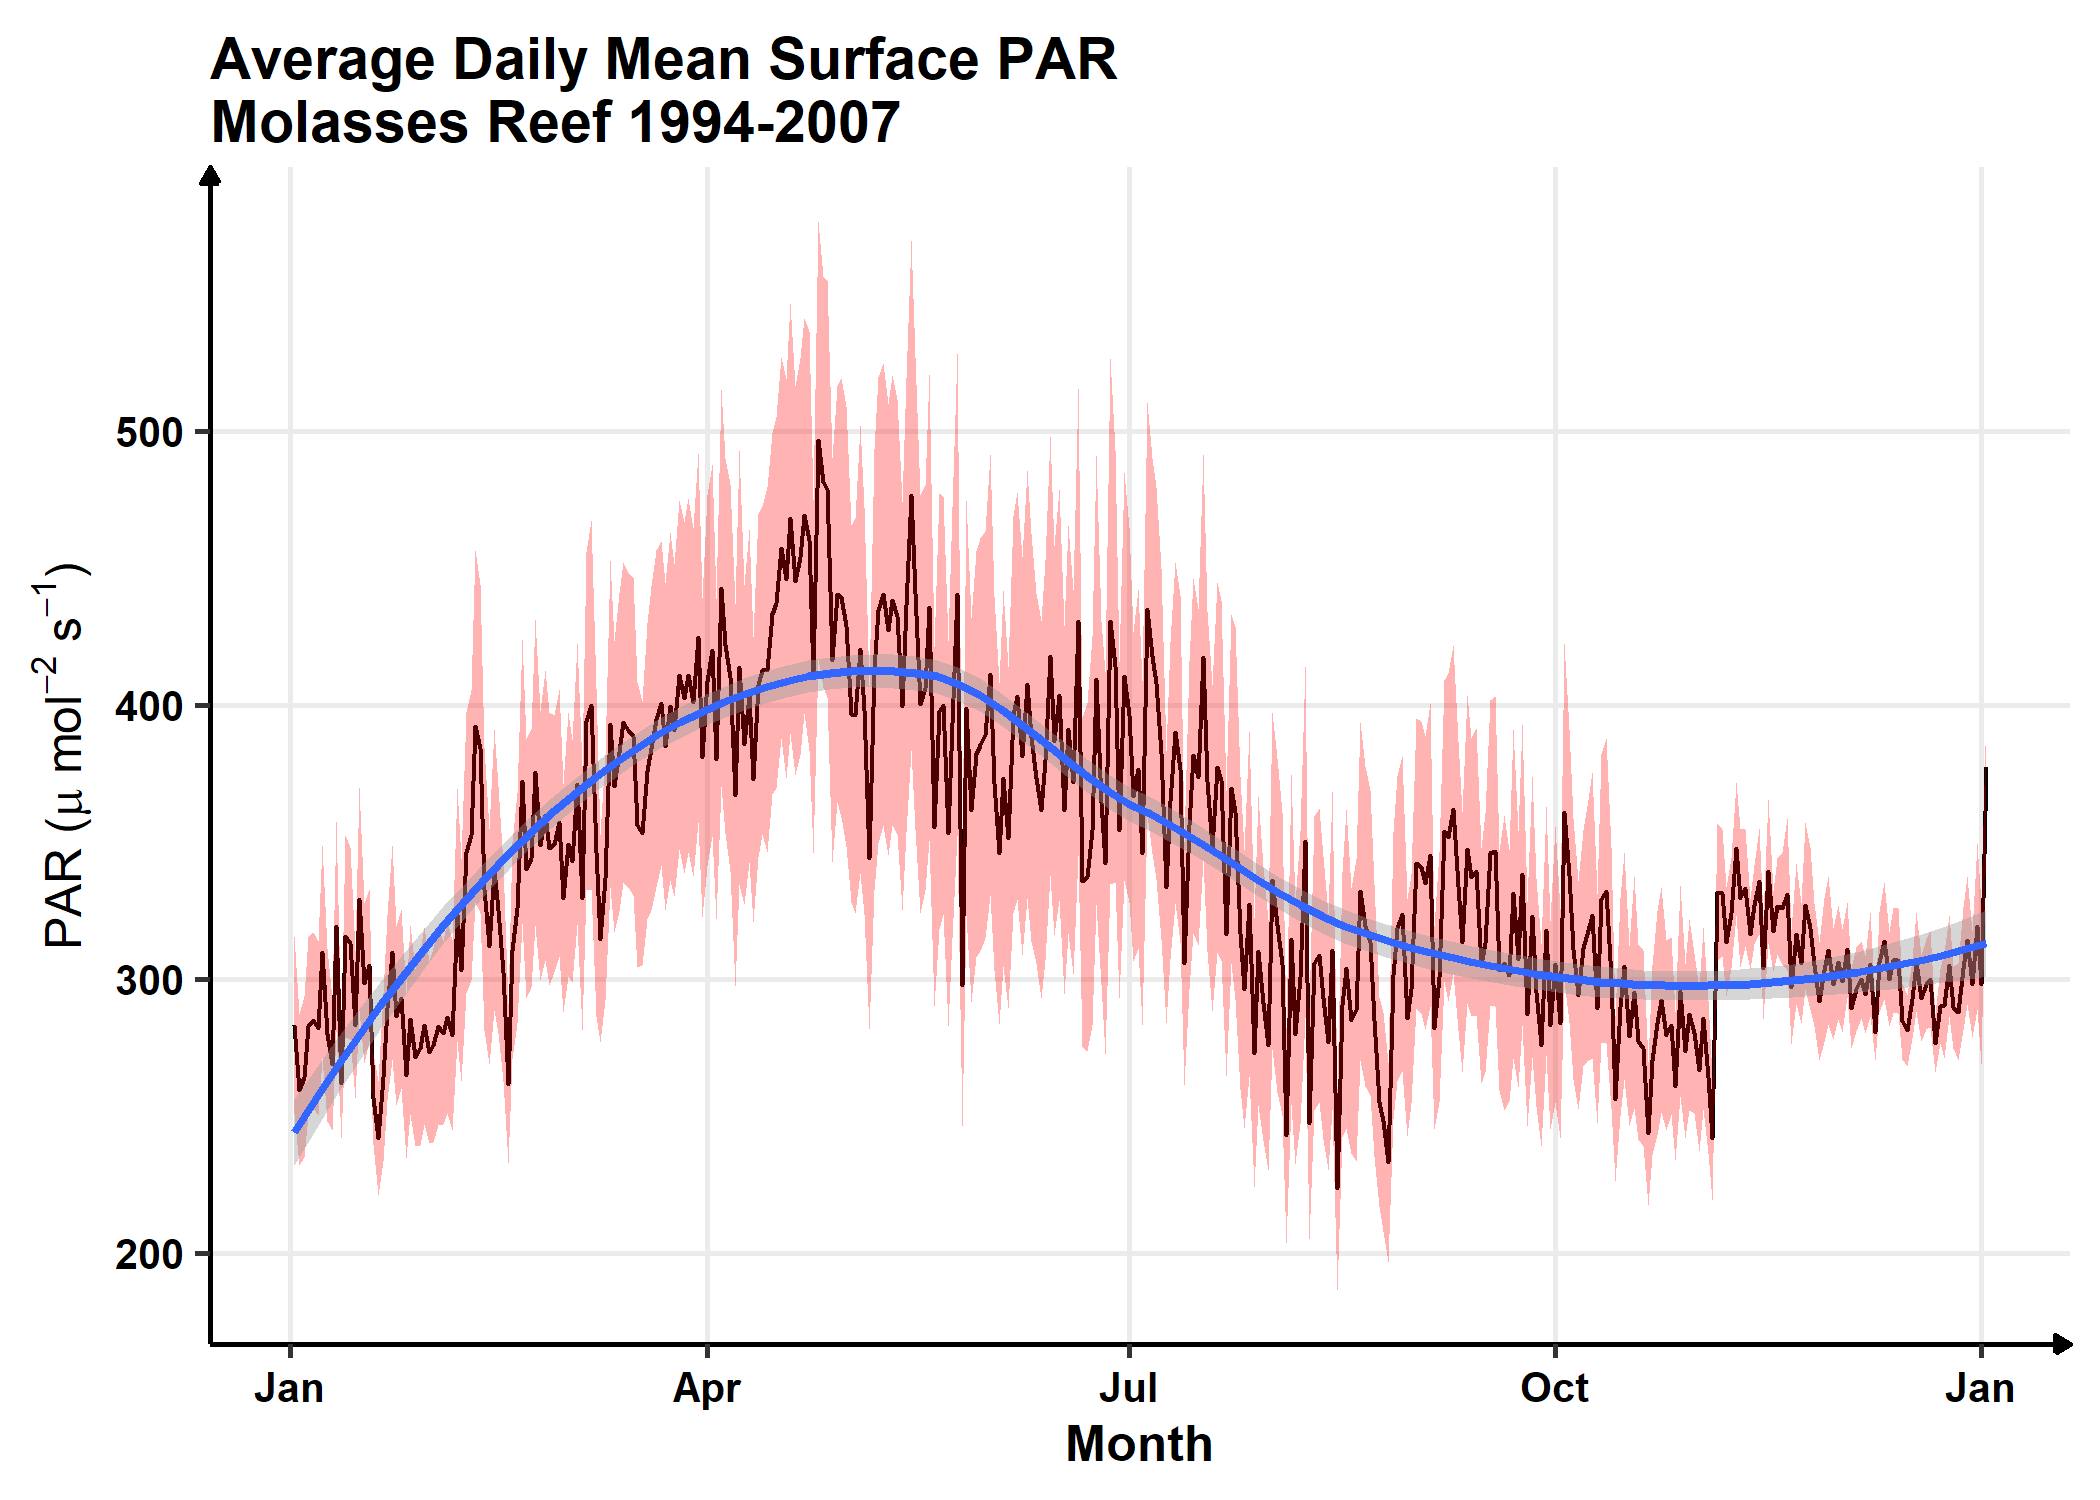
NCEI Data
I found this dataset on NCEI for one of the C-MAN stations located at Molasses Reef (25.012, -80.376). This data complements the MODIS derived data from above.
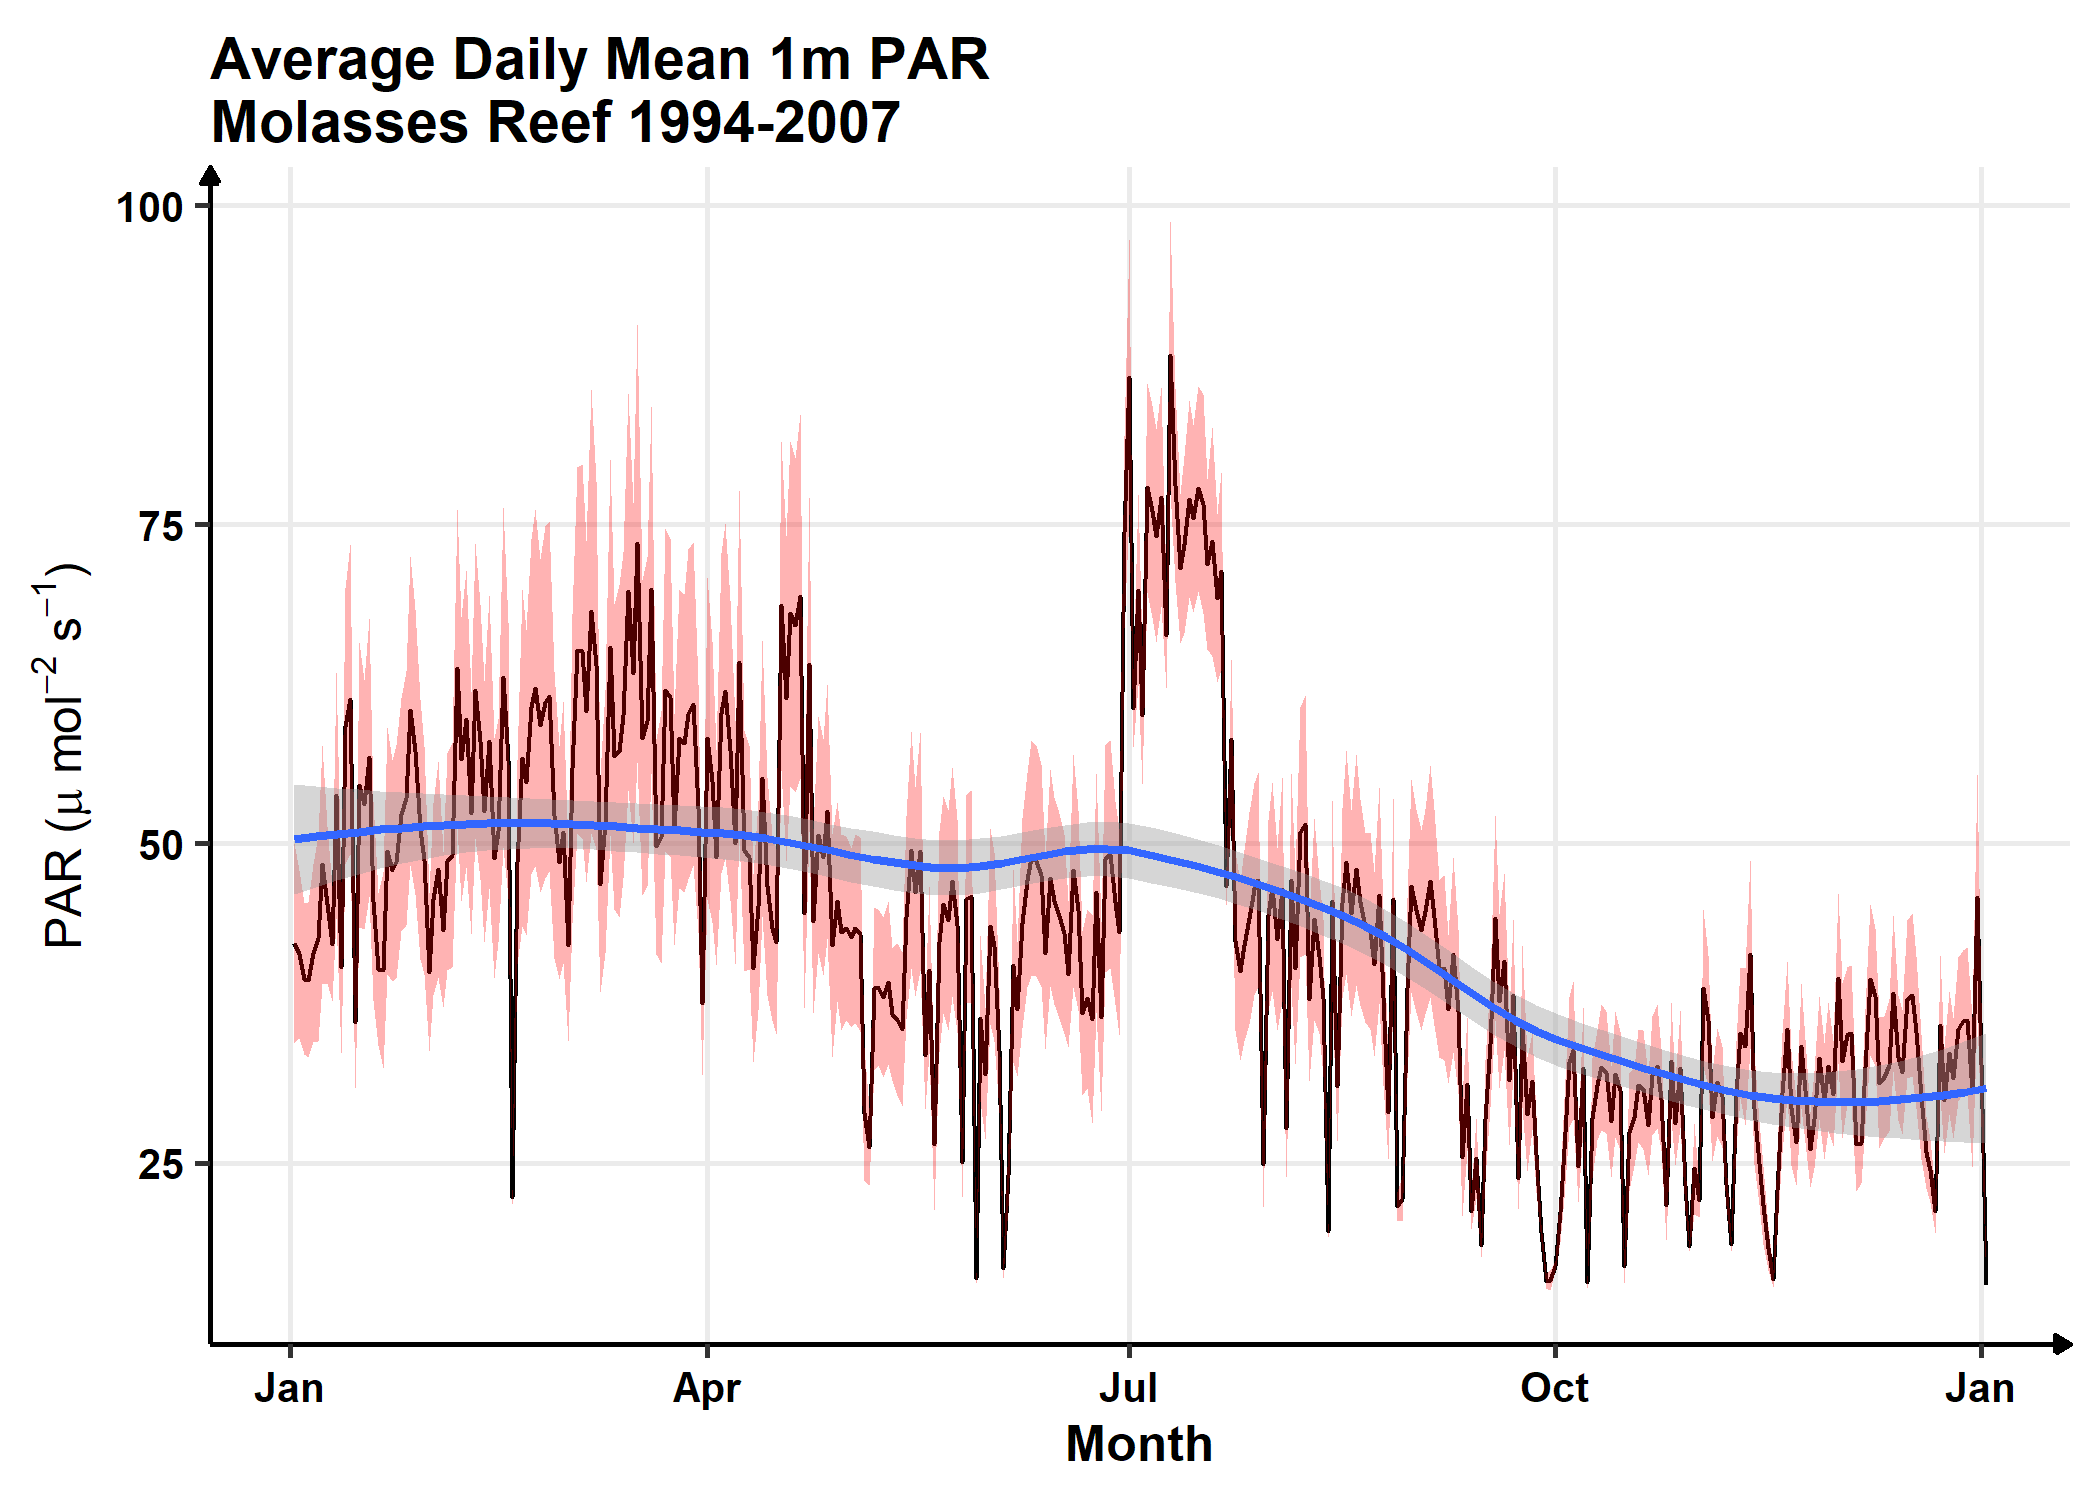
Don’t really trust the subsurface (1m) dataset. My guess is that it’s right below the buoy and thus it is partly shaded by said buoy, and the odd pattern may align with prevailing winds as that may move the buoy around. Not sure if it’s a moored buoy. Shot in the dark though :)
Takeaways
The seasonal curve follows as expected with a peak around the summer solstice and a minima around the winter solstice. A peak of 550 micromol at the summer solstice with a decrease proportional to the seasonality from the MODIS data is presented here:
Moonlight Intensity
The estimated moonlight intensity during the days of PAR collection on the nursery is 57%. The average PAR experienced at the nursery during that time was 0.045. Thus, the estimated Full Moon par is 0.08 PAR. To achieve this illumination, the point intensity of the moonlight should be set to 40%. The moonphase will then dynamically alter this intensity between 0-40% based on that day’s estimated intensity.
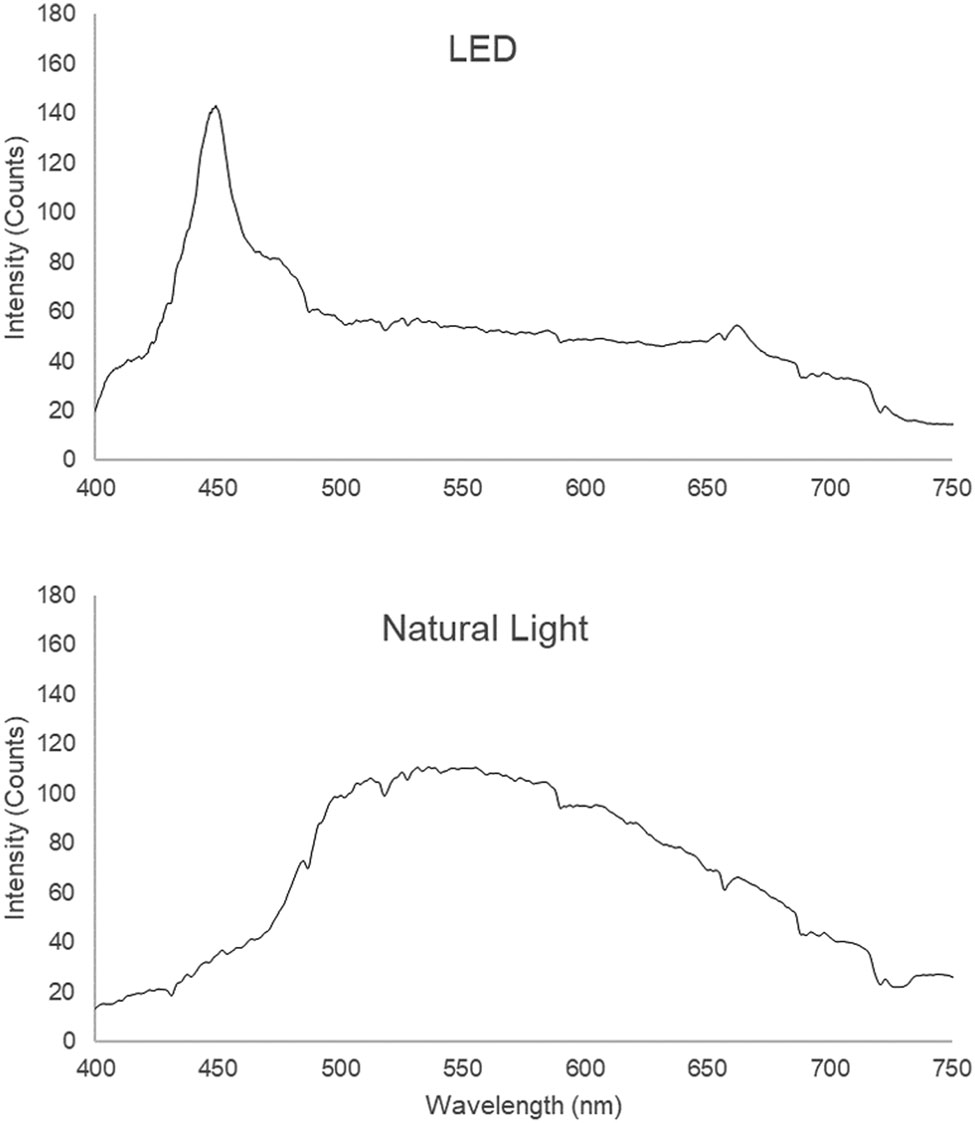
Natural Spectrums
We have not yet collected natural light spectrums. Here is some published spectra:
Relevant Publications
-
Slagel et al. Compared growth of Acropora cervicornis at FLAQ grown under LED v natural sunlight. LED corals had greater G than natural light corals, but TLE did not differ. However, photosynthetic efficiency was greater in natural light corals.
-
Wijgerde et al. Observed greater survivorship under blue light, no real observable differences in symbiont health/density. No replication of treatments across multiple papers by the same authors. Intro/discussion well cited for further investigations
-
Martinez-Rugerio et al. ICRS Talk Experimentally demonstrated dissepiments are formed by a moon cue. Observed no differences in G between simulated moon and no moon treatment groups, but observed reduced extension and greater skeletal bulk density. There’s a DeCarlo and Cohen paper in Coral Reefs which looked at dissepiments under ct scan in field corals and observed a lunar cue too.