Cheeca DO Analysis
research 06 May 2024Overview
Here I am analyzing the available dissolved oxygen (DO) data from Cheeca Rocks, Florida Keys. The data is available from NCEI.
All the Data
Figure 2. DO Data (mg/L) throughout the monitoring period
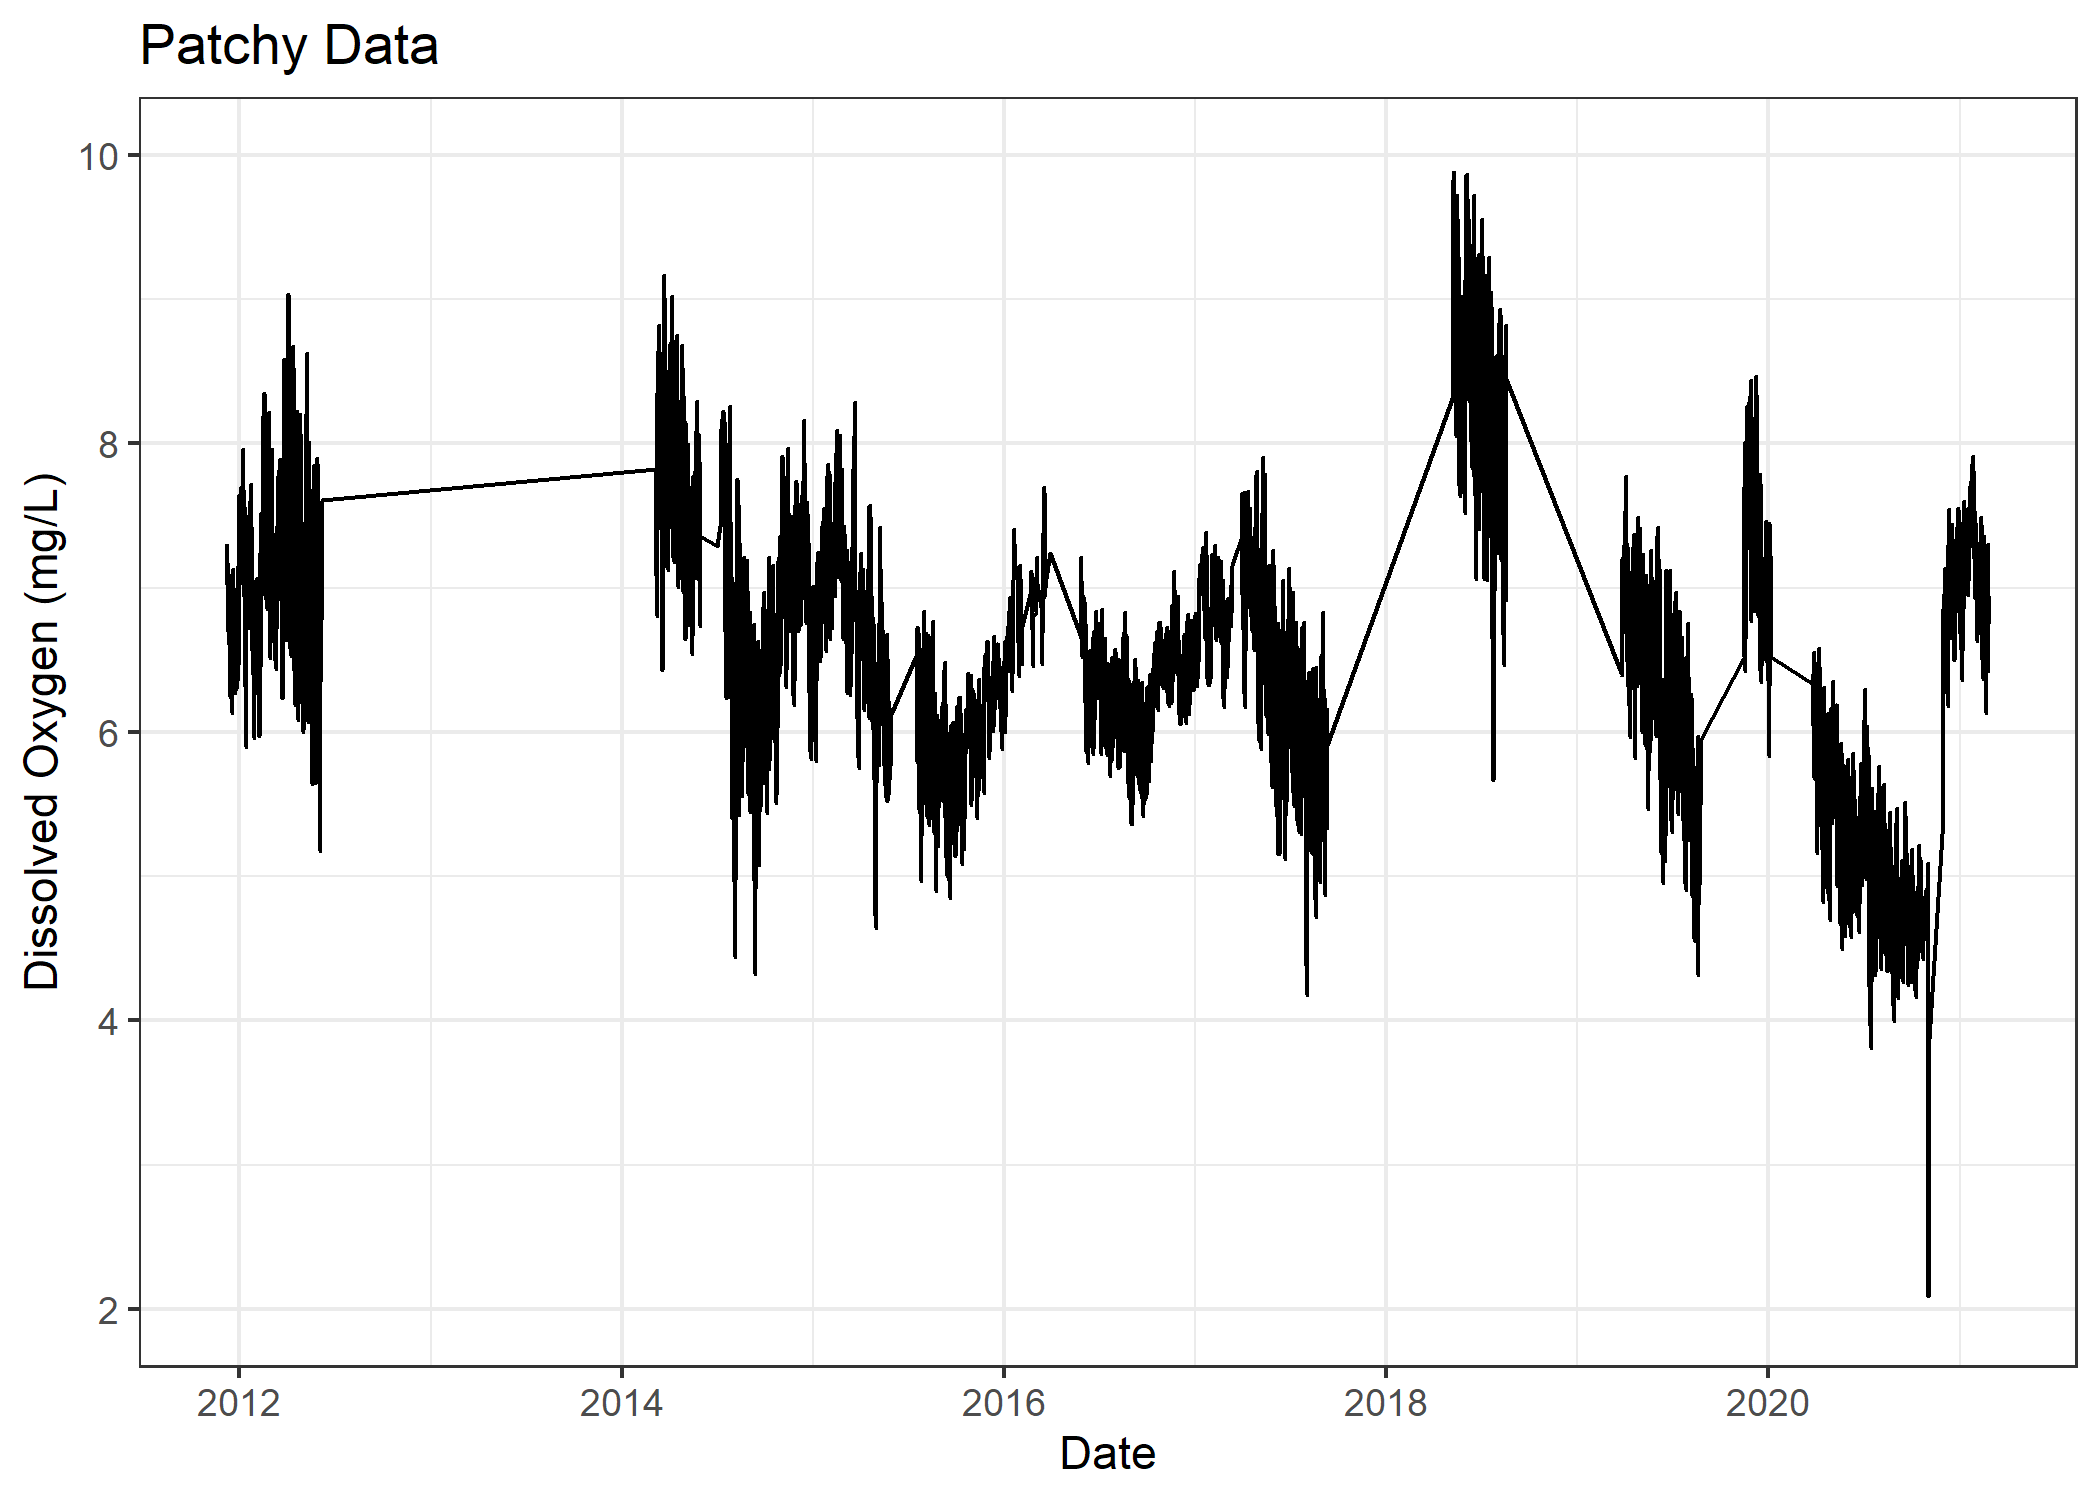 The data is quite patchy indicating lapses in data collection. Furthere
there is a general trendline around 7 mg/L, but there is a period of
highs in 2018 and lows in 2020.
The data is quite patchy indicating lapses in data collection. Furthere
there is a general trendline around 7 mg/L, but there is a period of
highs in 2018 and lows in 2020.
Let’s zoom into these years.
Figure 3. 2018: Seems offly high
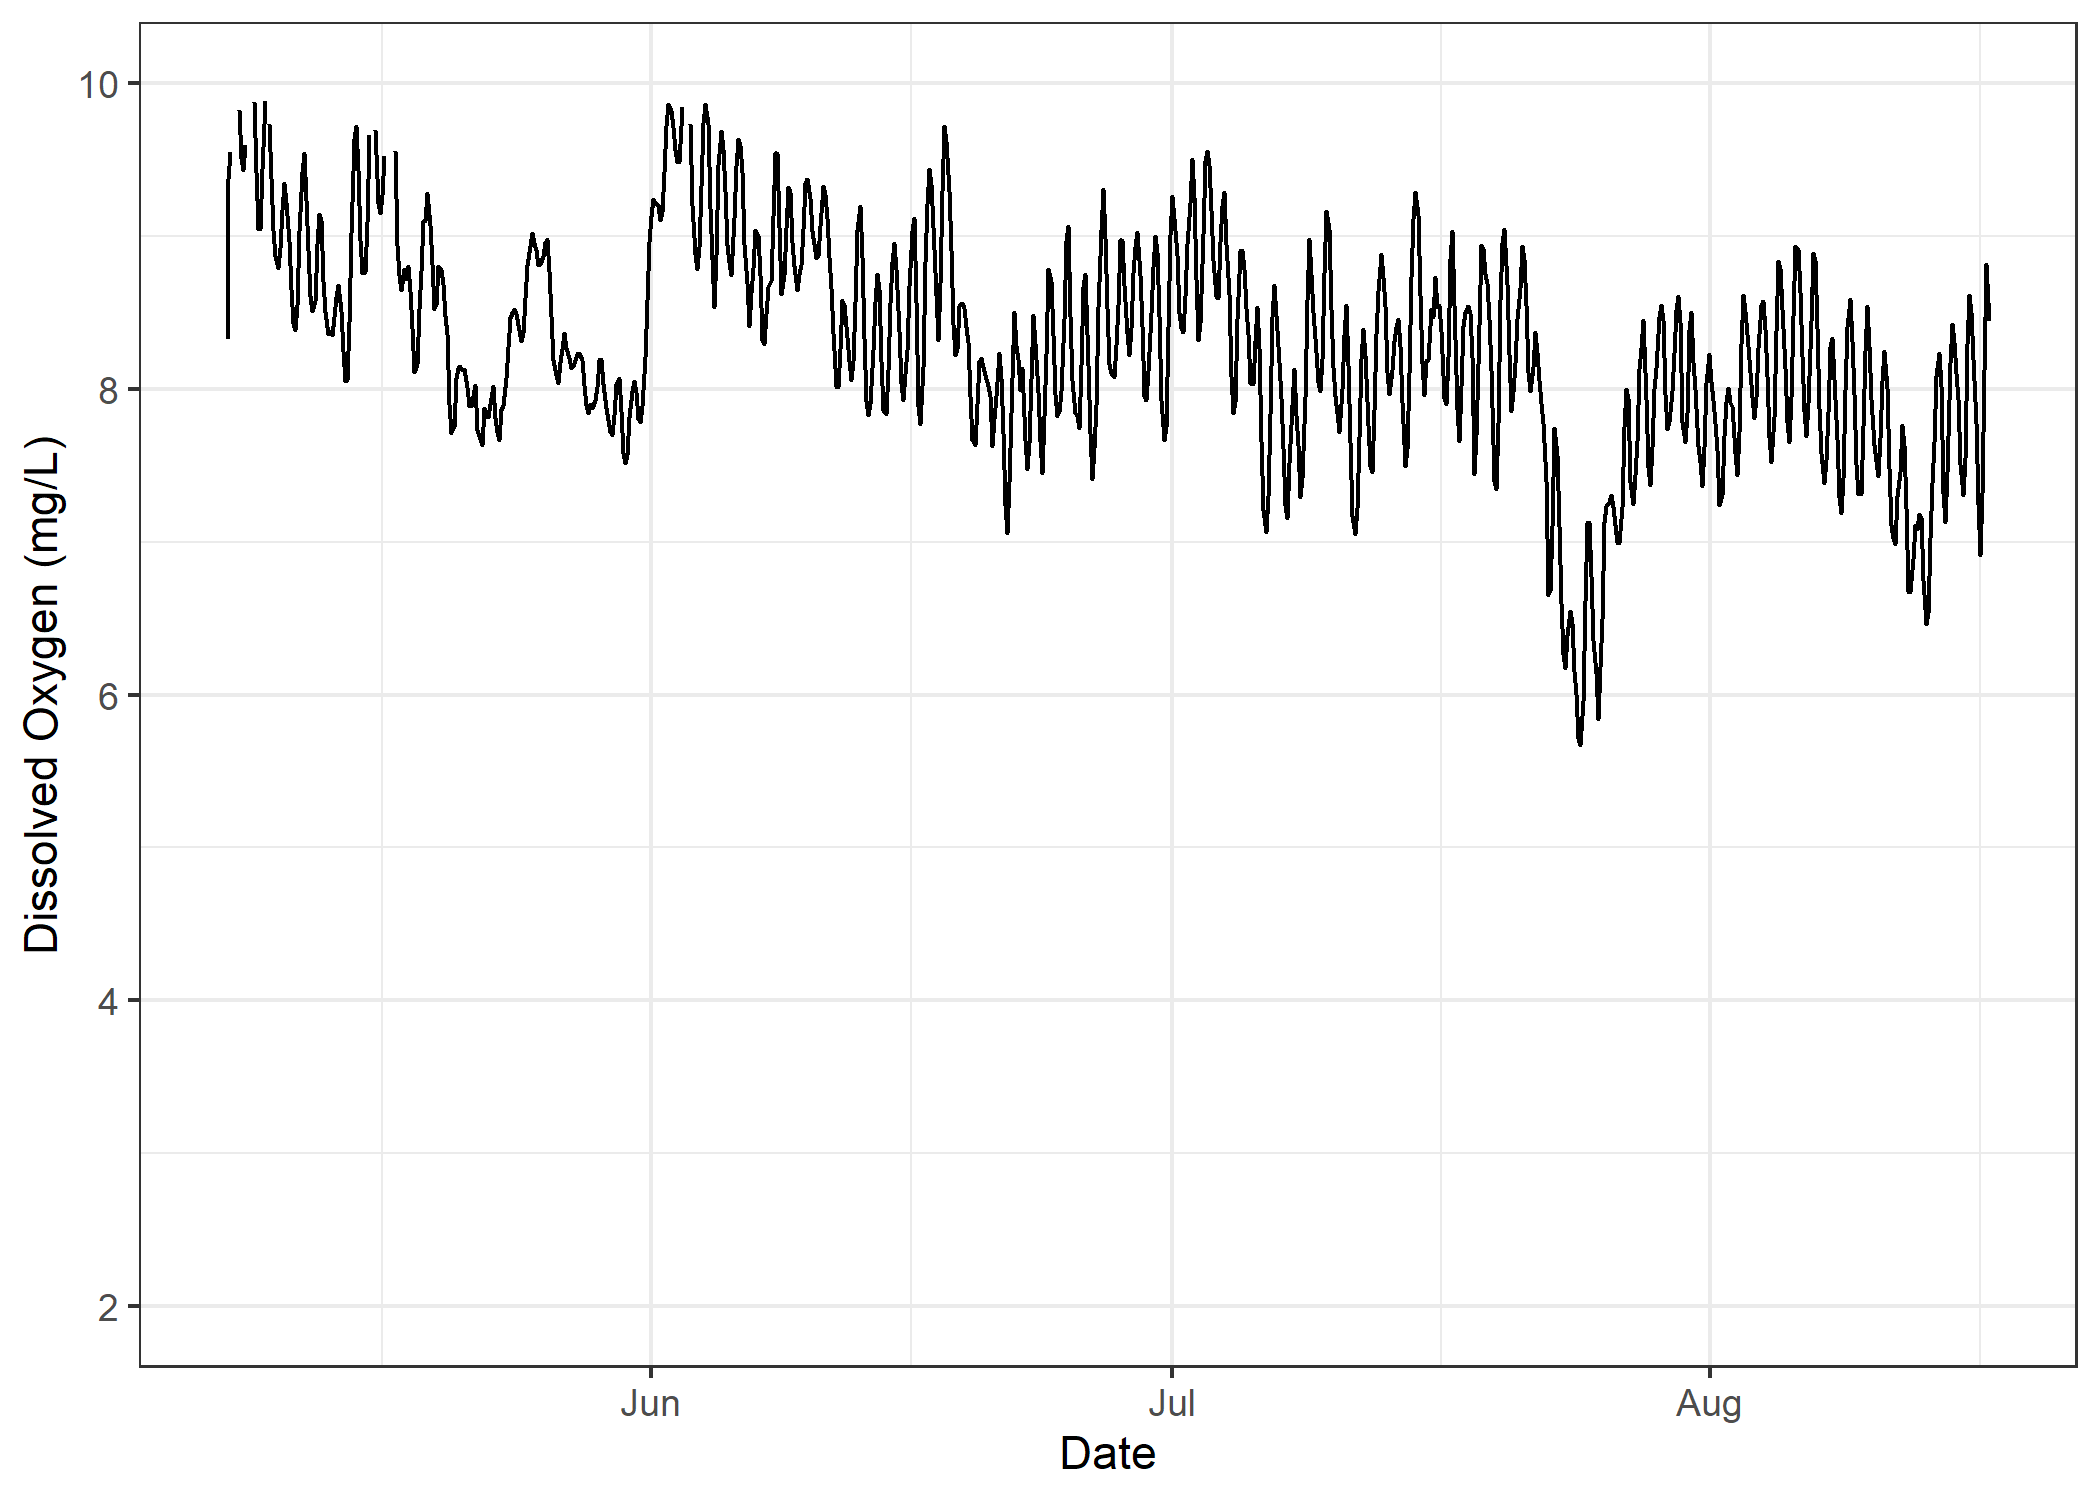
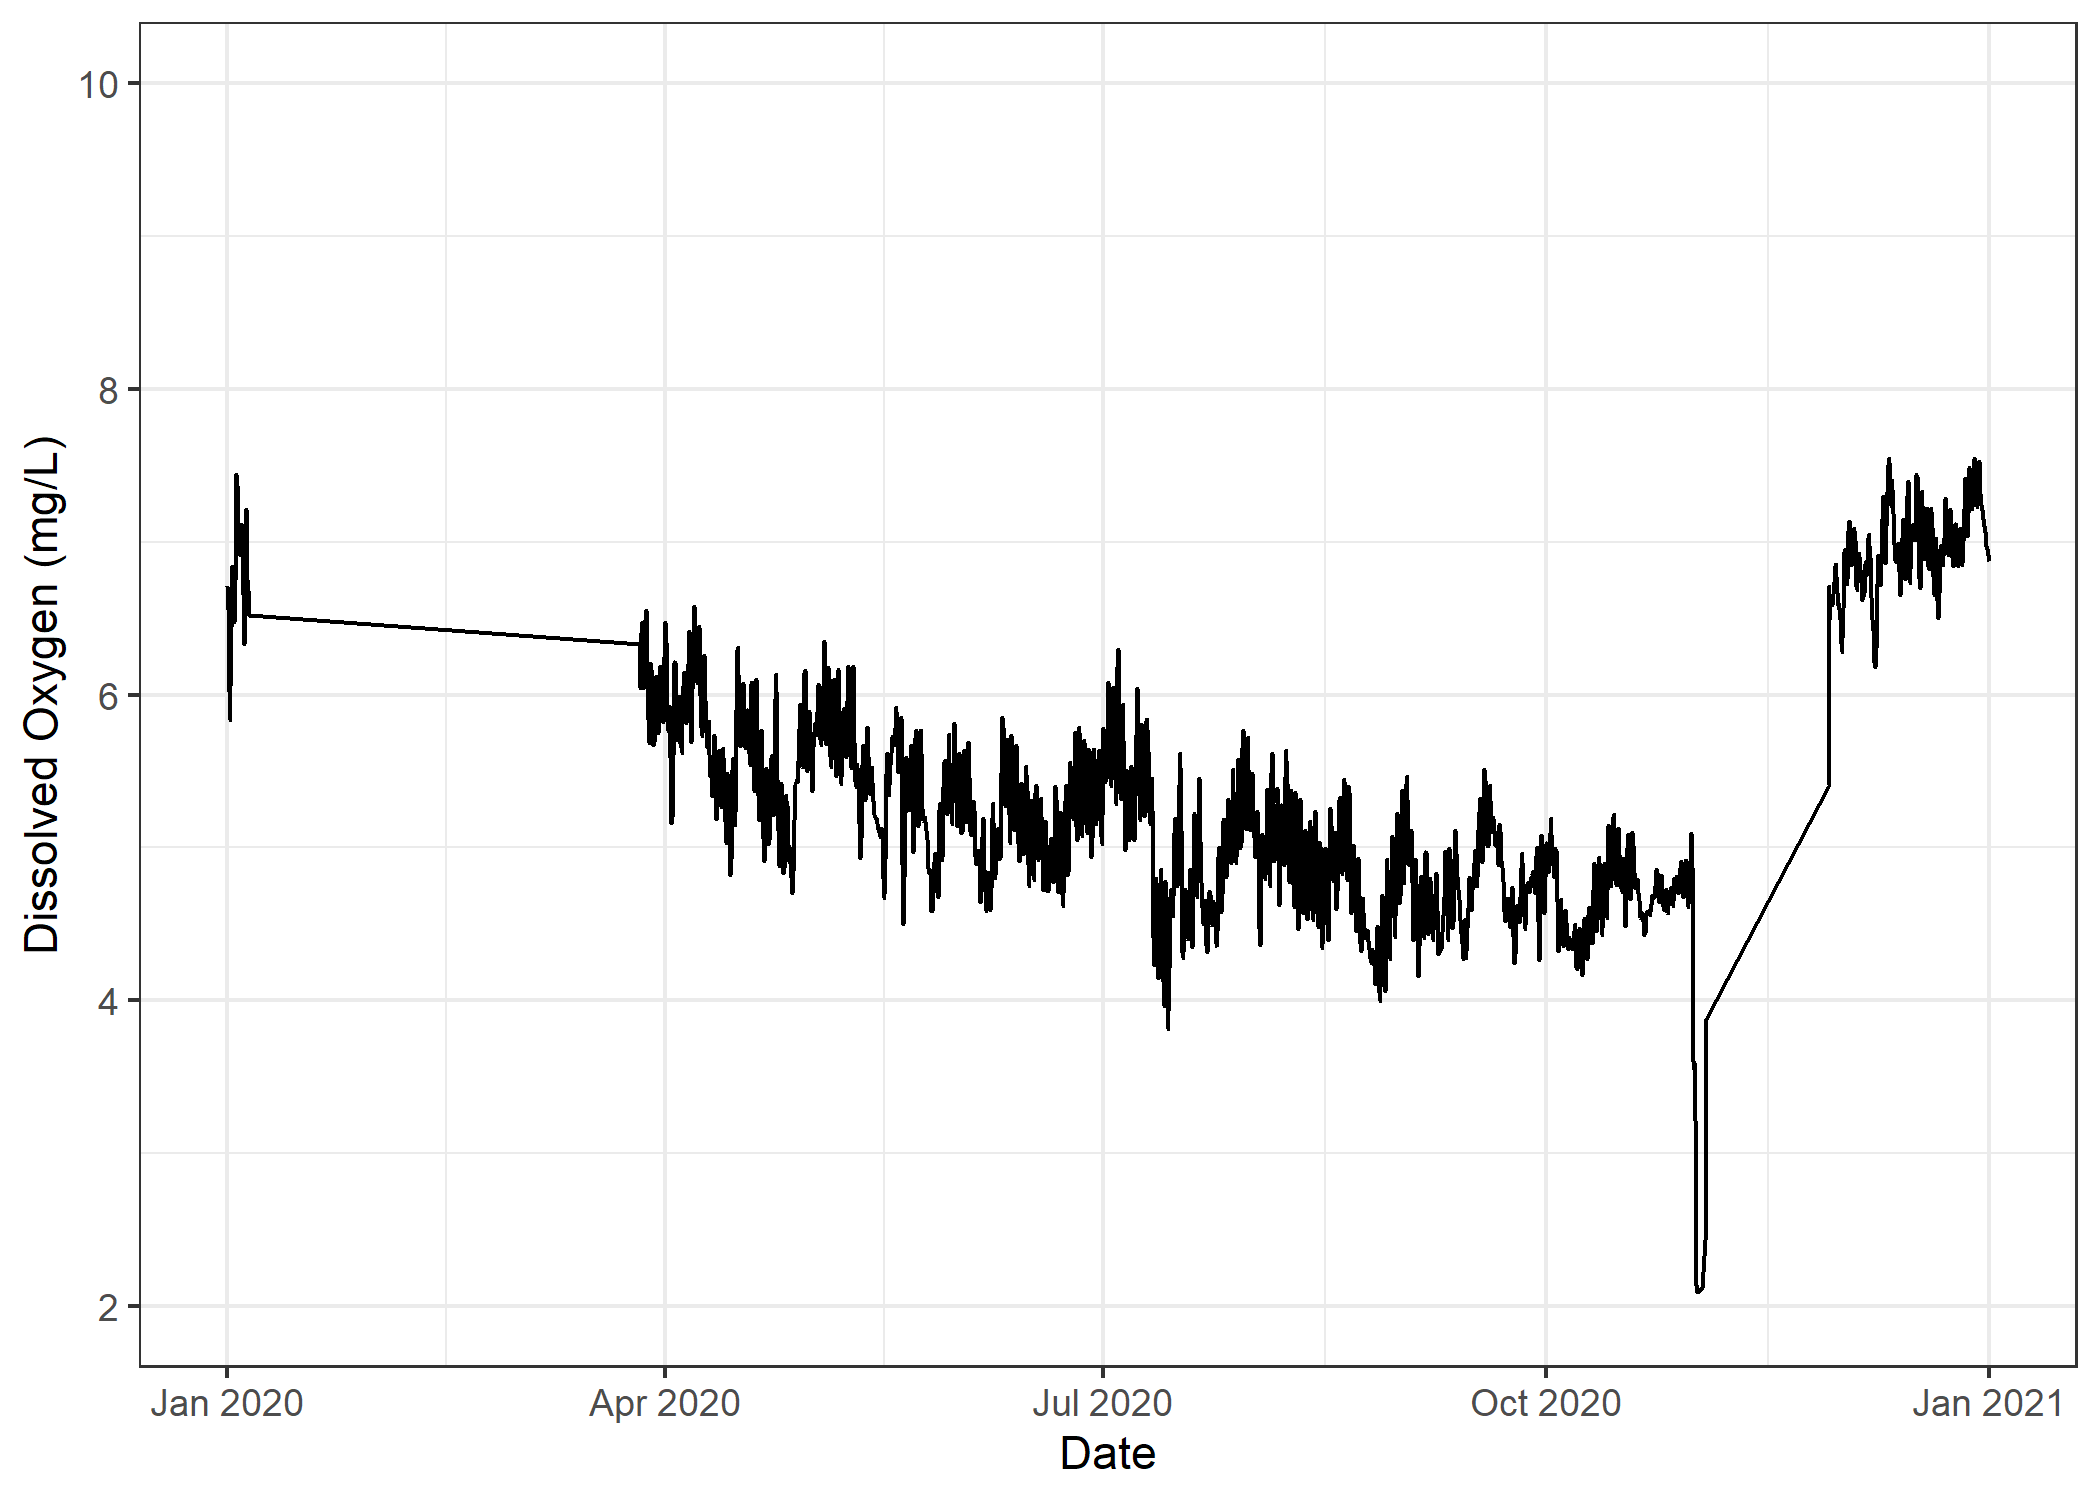
Figure 4. 2020: Low then Sensor Goes Offline in November
Data during most of 2018 looks about ~2 mg/L too high. There seems to be an interesting dip in late July, which could have been a mild hypoxic event, but since the surrounding readings were high, it’s hard to say.
Data during 2020 looks artificially low throughout the year. The sudden drop in November and then its rebounding to ~7 suggests it was malfunctioning, brought in for servicing, calibrated, and redeployed in December.
Since I want to capture normal variability, I’ll throw away these 2018 and 2020 datasets.
Lets look at Diel Variability
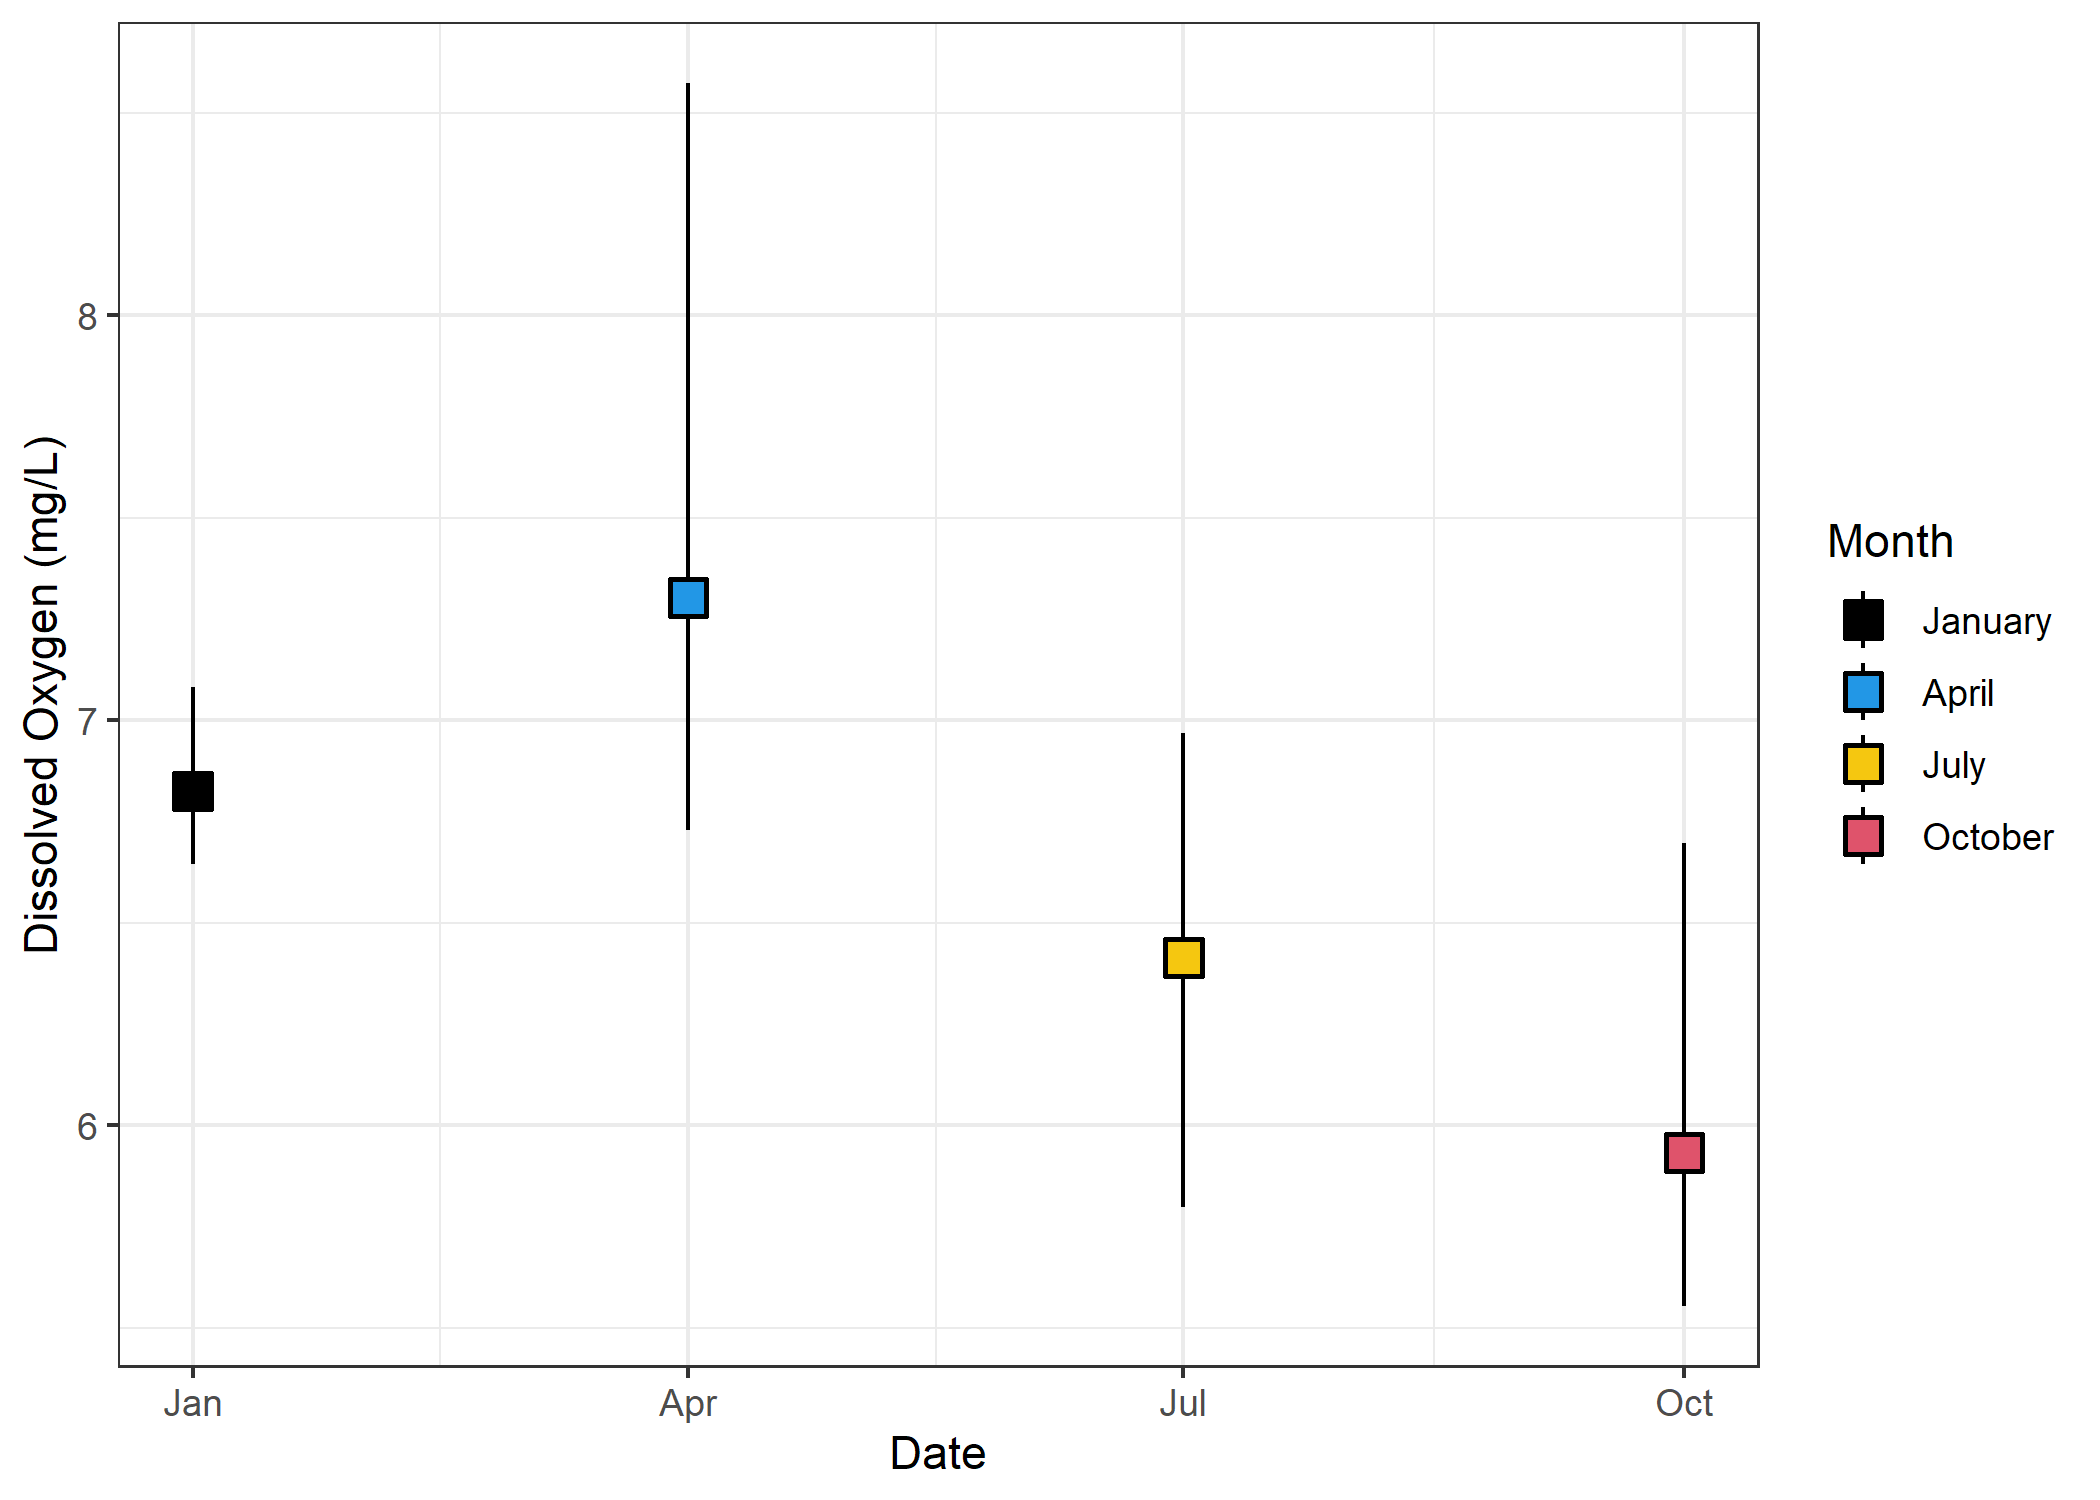
Figure 5. Average Diel Variability Throughout the Year. Filled circles denote 3-month rounded daily mean DO; lines extend to 3-month rounded daily minimum and maximum DO
Where do these observations come from?
Figure 6. Diel Variability across Three Month-Binned Monitoring Period. Filled circles denote 3-month rounded daily mean DO; lines extend to 3-month rounded daily minimum and maximum DO
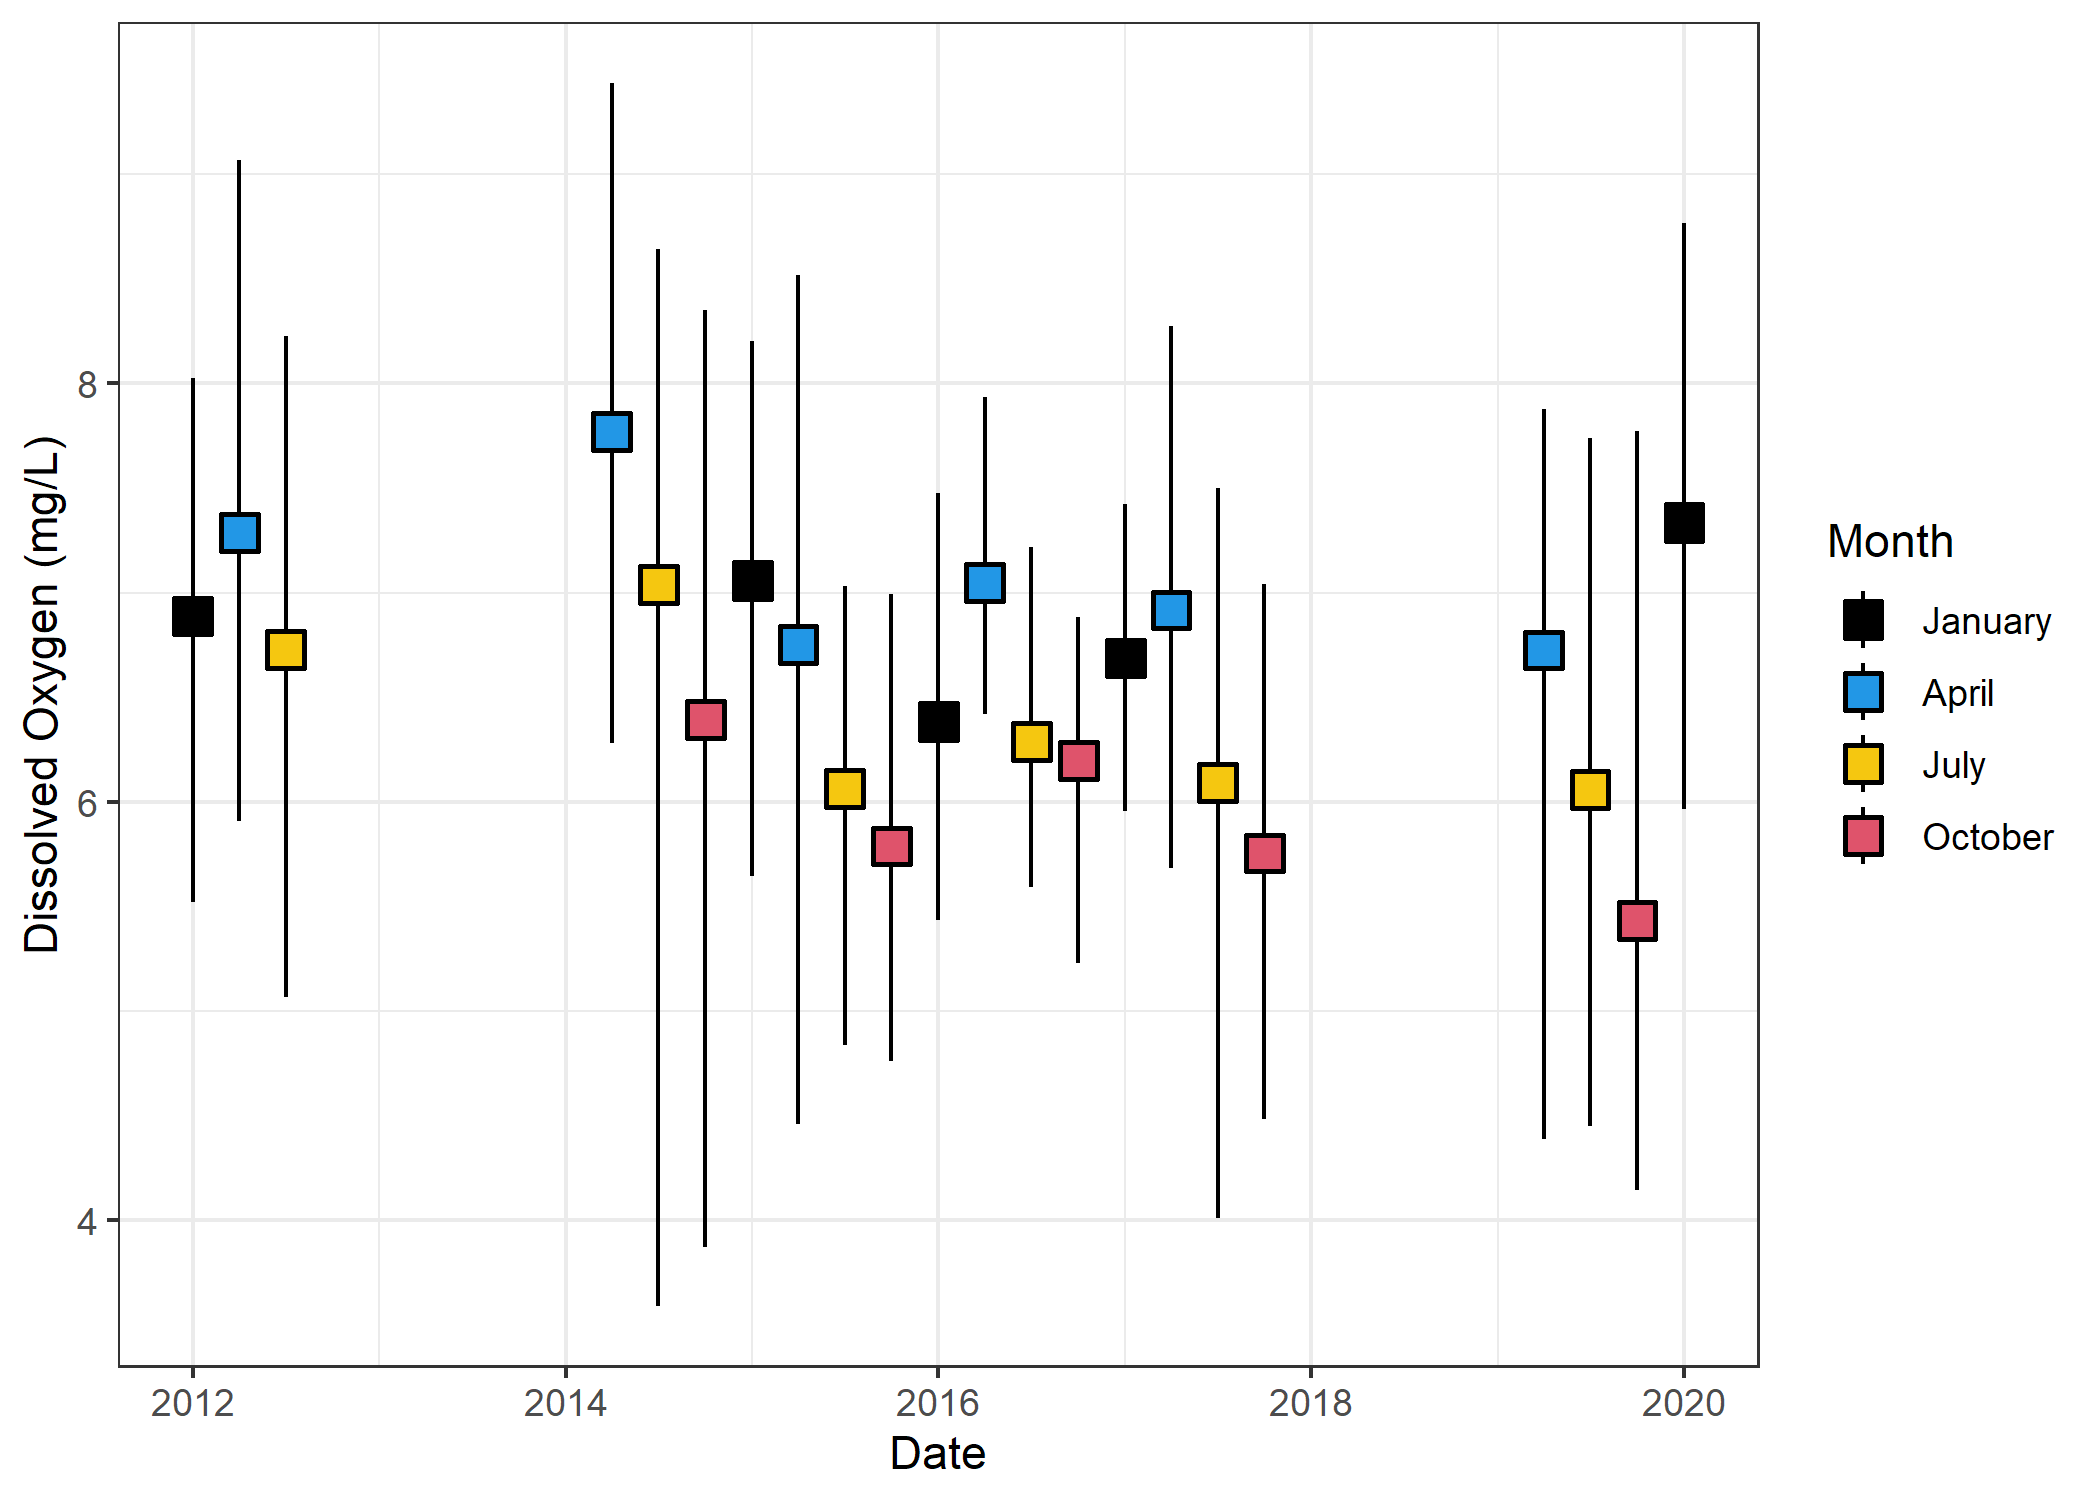 Overall there seems to be a seasonal component with the dry, windy
season (November-April; Black and Blues) having higher DO than the wet
season (May-October; Red and Yellows). Going to create 2 diel plots for
2 seasons.
Overall there seems to be a seasonal component with the dry, windy
season (November-April; Black and Blues) having higher DO than the wet
season (May-October; Red and Yellows). Going to create 2 diel plots for
2 seasons.
Figure 7. Diel Variability Plots
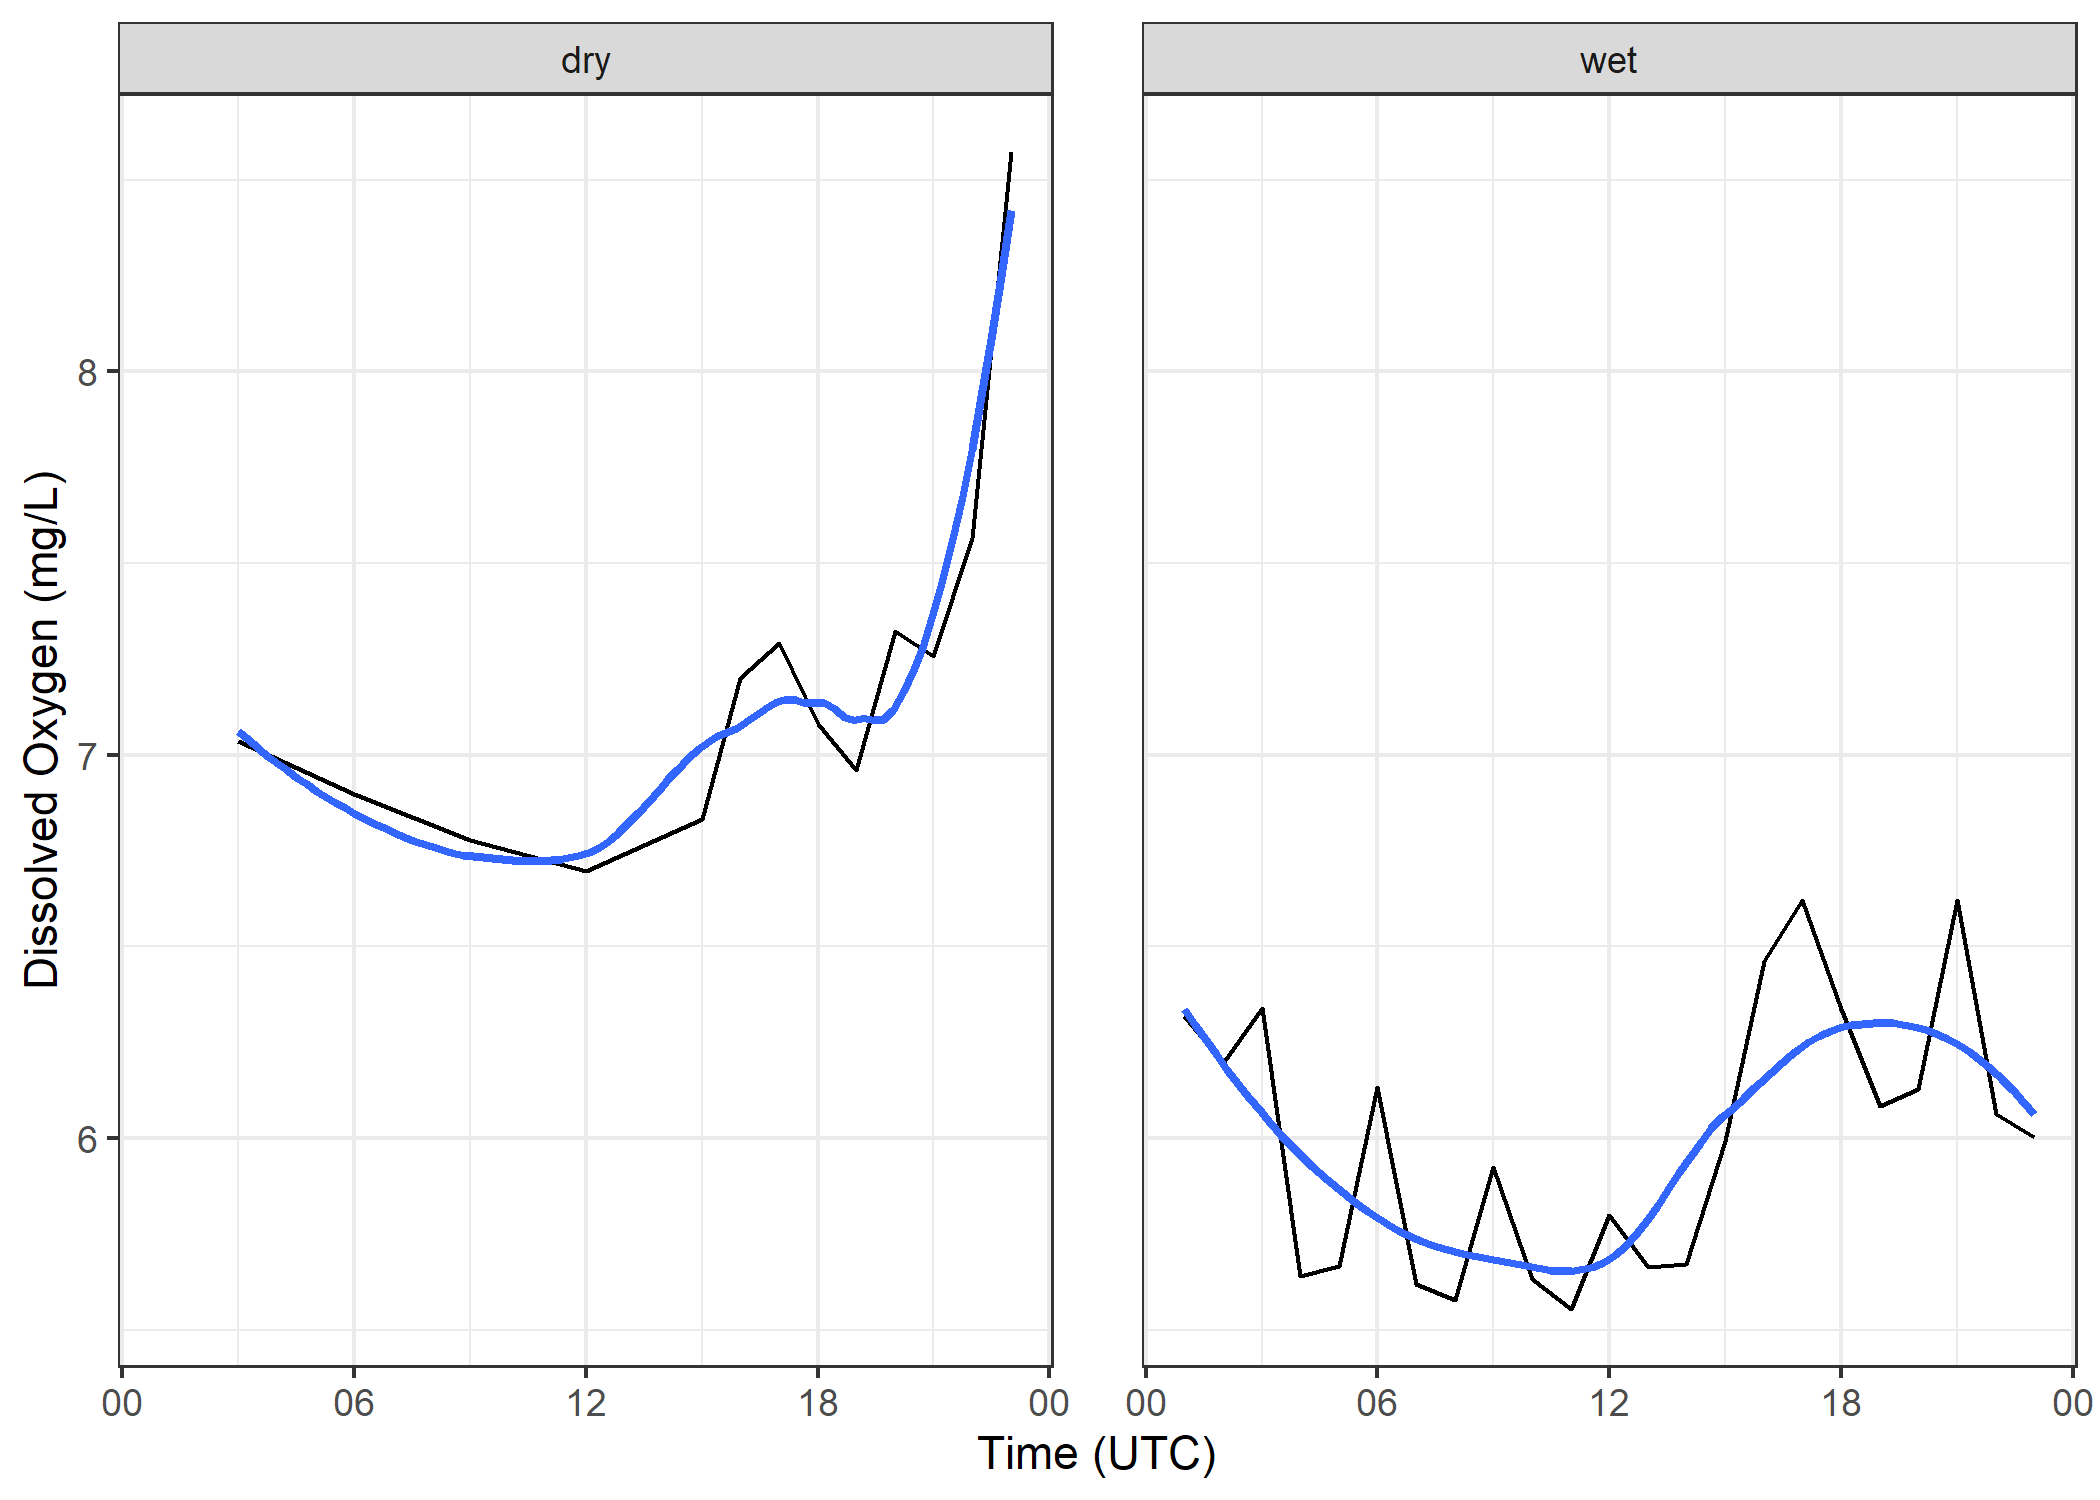 The dry season panel is pretty messy and doesn’t make much sense to me.
Around midnight it shoots above 8. I’d expect the peak to be around
17-19 since peak should lag solar noon by about 30-120 minutes, and
Cheeca’s solar noon (UTC+5) is 17. The wet season panel looks like a
nice sine wave approximating the changing of photosynthesis to match
sunlight with a peak at the expected time.
The dry season panel is pretty messy and doesn’t make much sense to me.
Around midnight it shoots above 8. I’d expect the peak to be around
17-19 since peak should lag solar noon by about 30-120 minutes, and
Cheeca’s solar noon (UTC+5) is 17. The wet season panel looks like a
nice sine wave approximating the changing of photosynthesis to match
sunlight with a peak at the expected time.
What if I do the same with an outlier filter applied:
Figure 8. Still messy
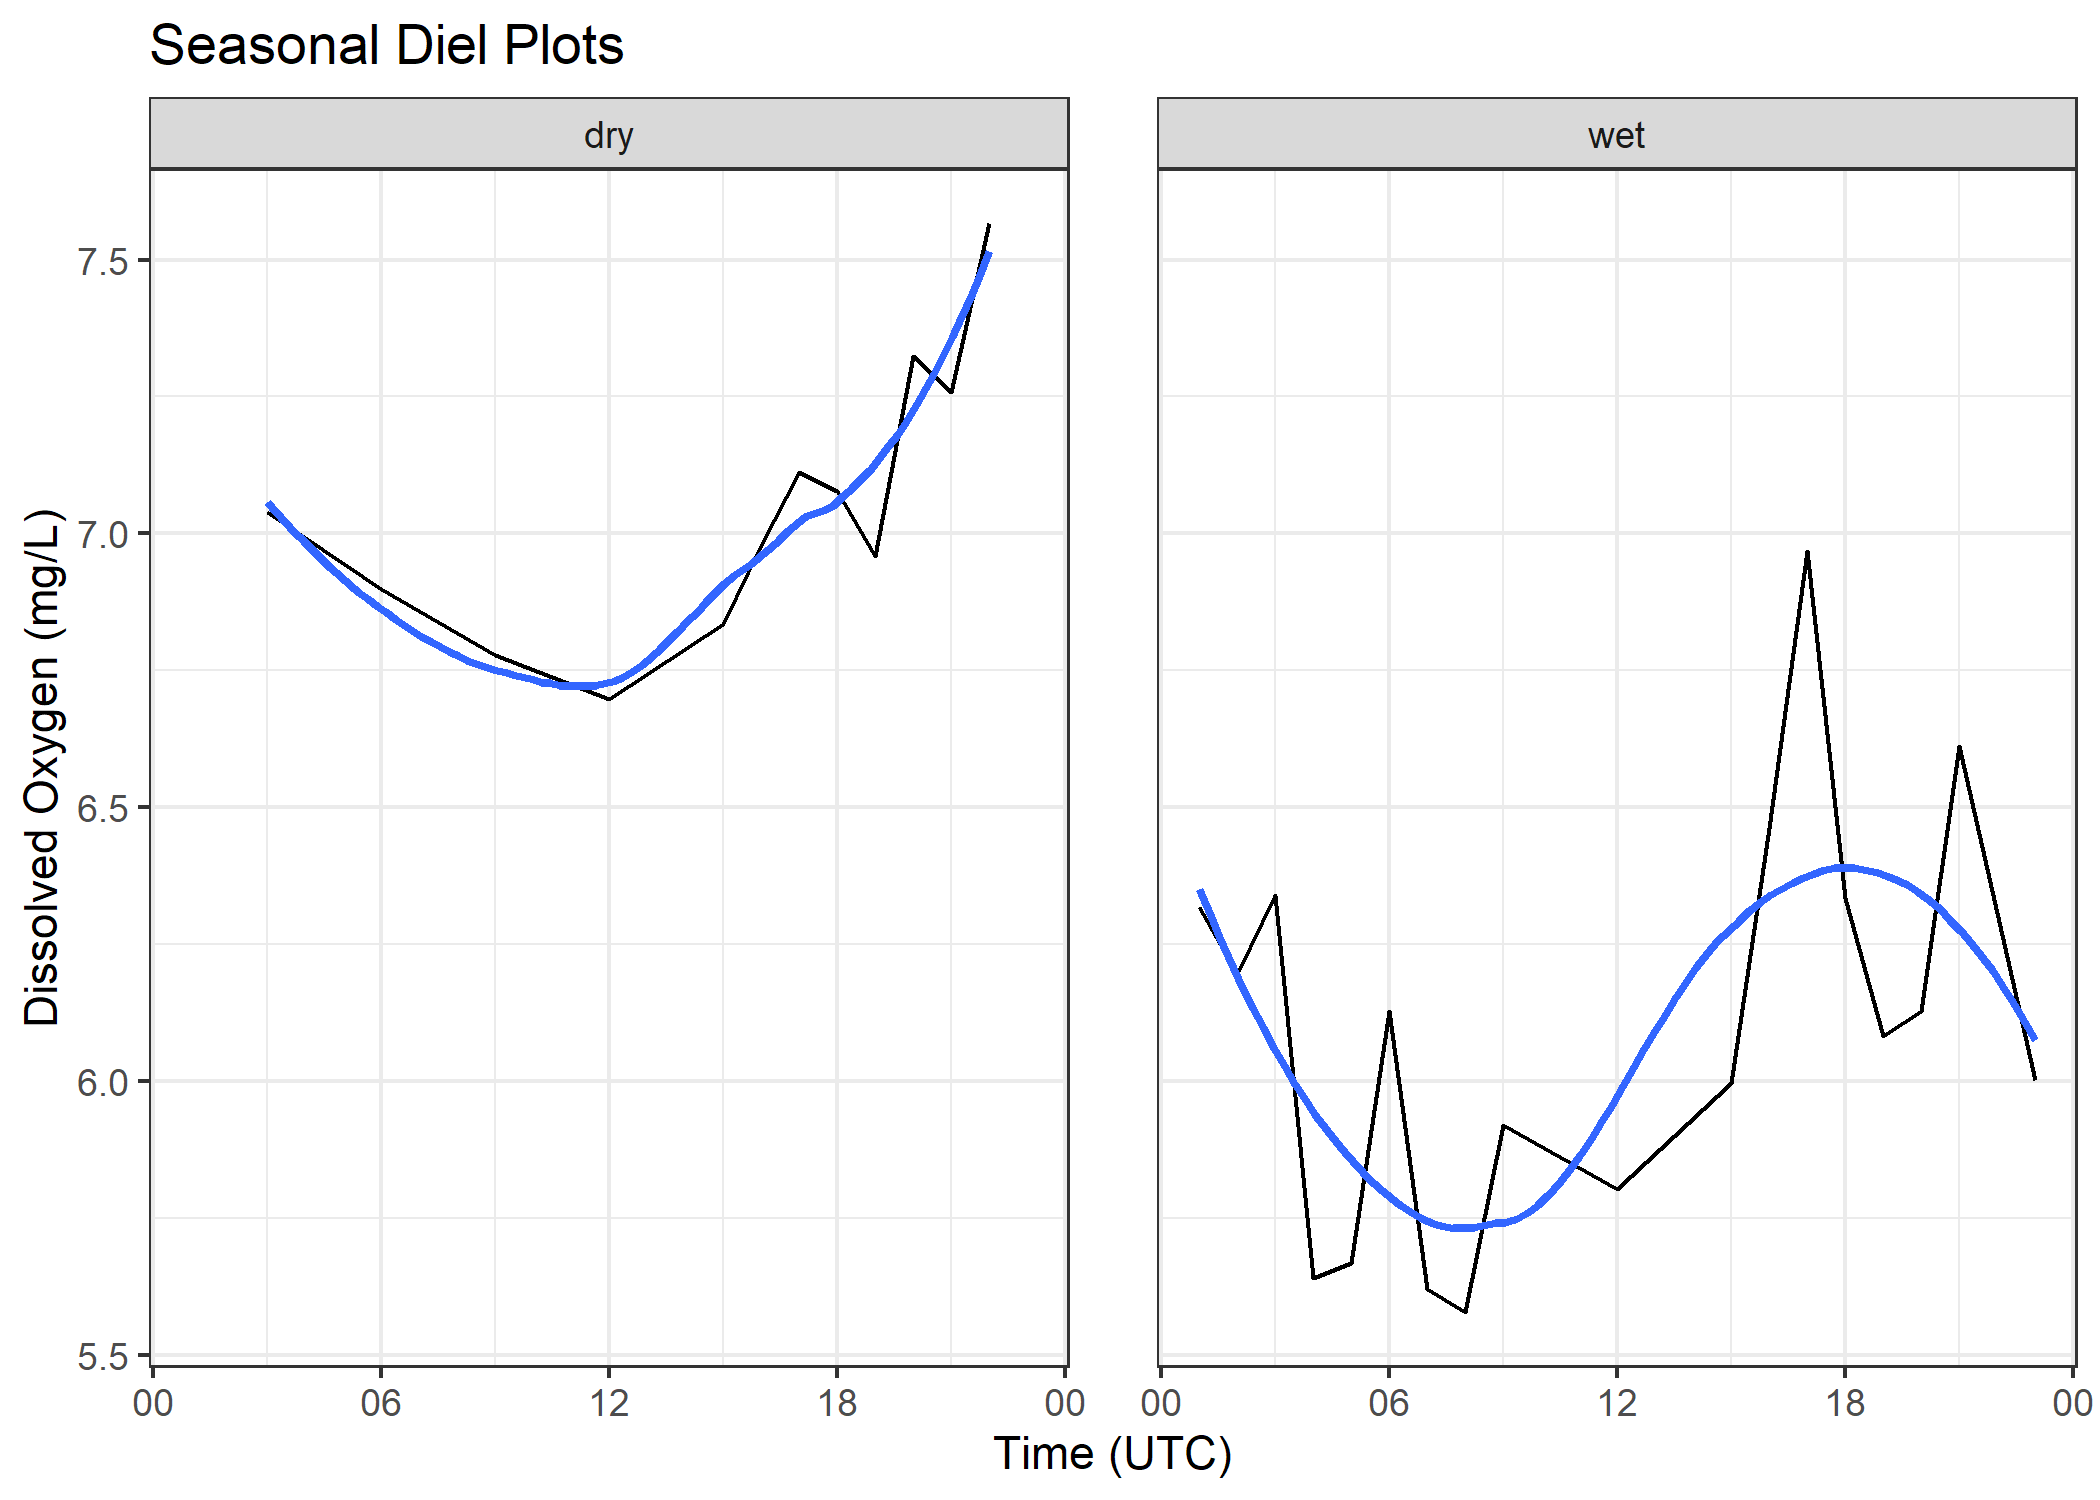
Figure 9. Seasonal DO Range; Filled circles denote seasonally averaged daily mean DO; lines extend to seasonally averaged daily minimum and maximum DO
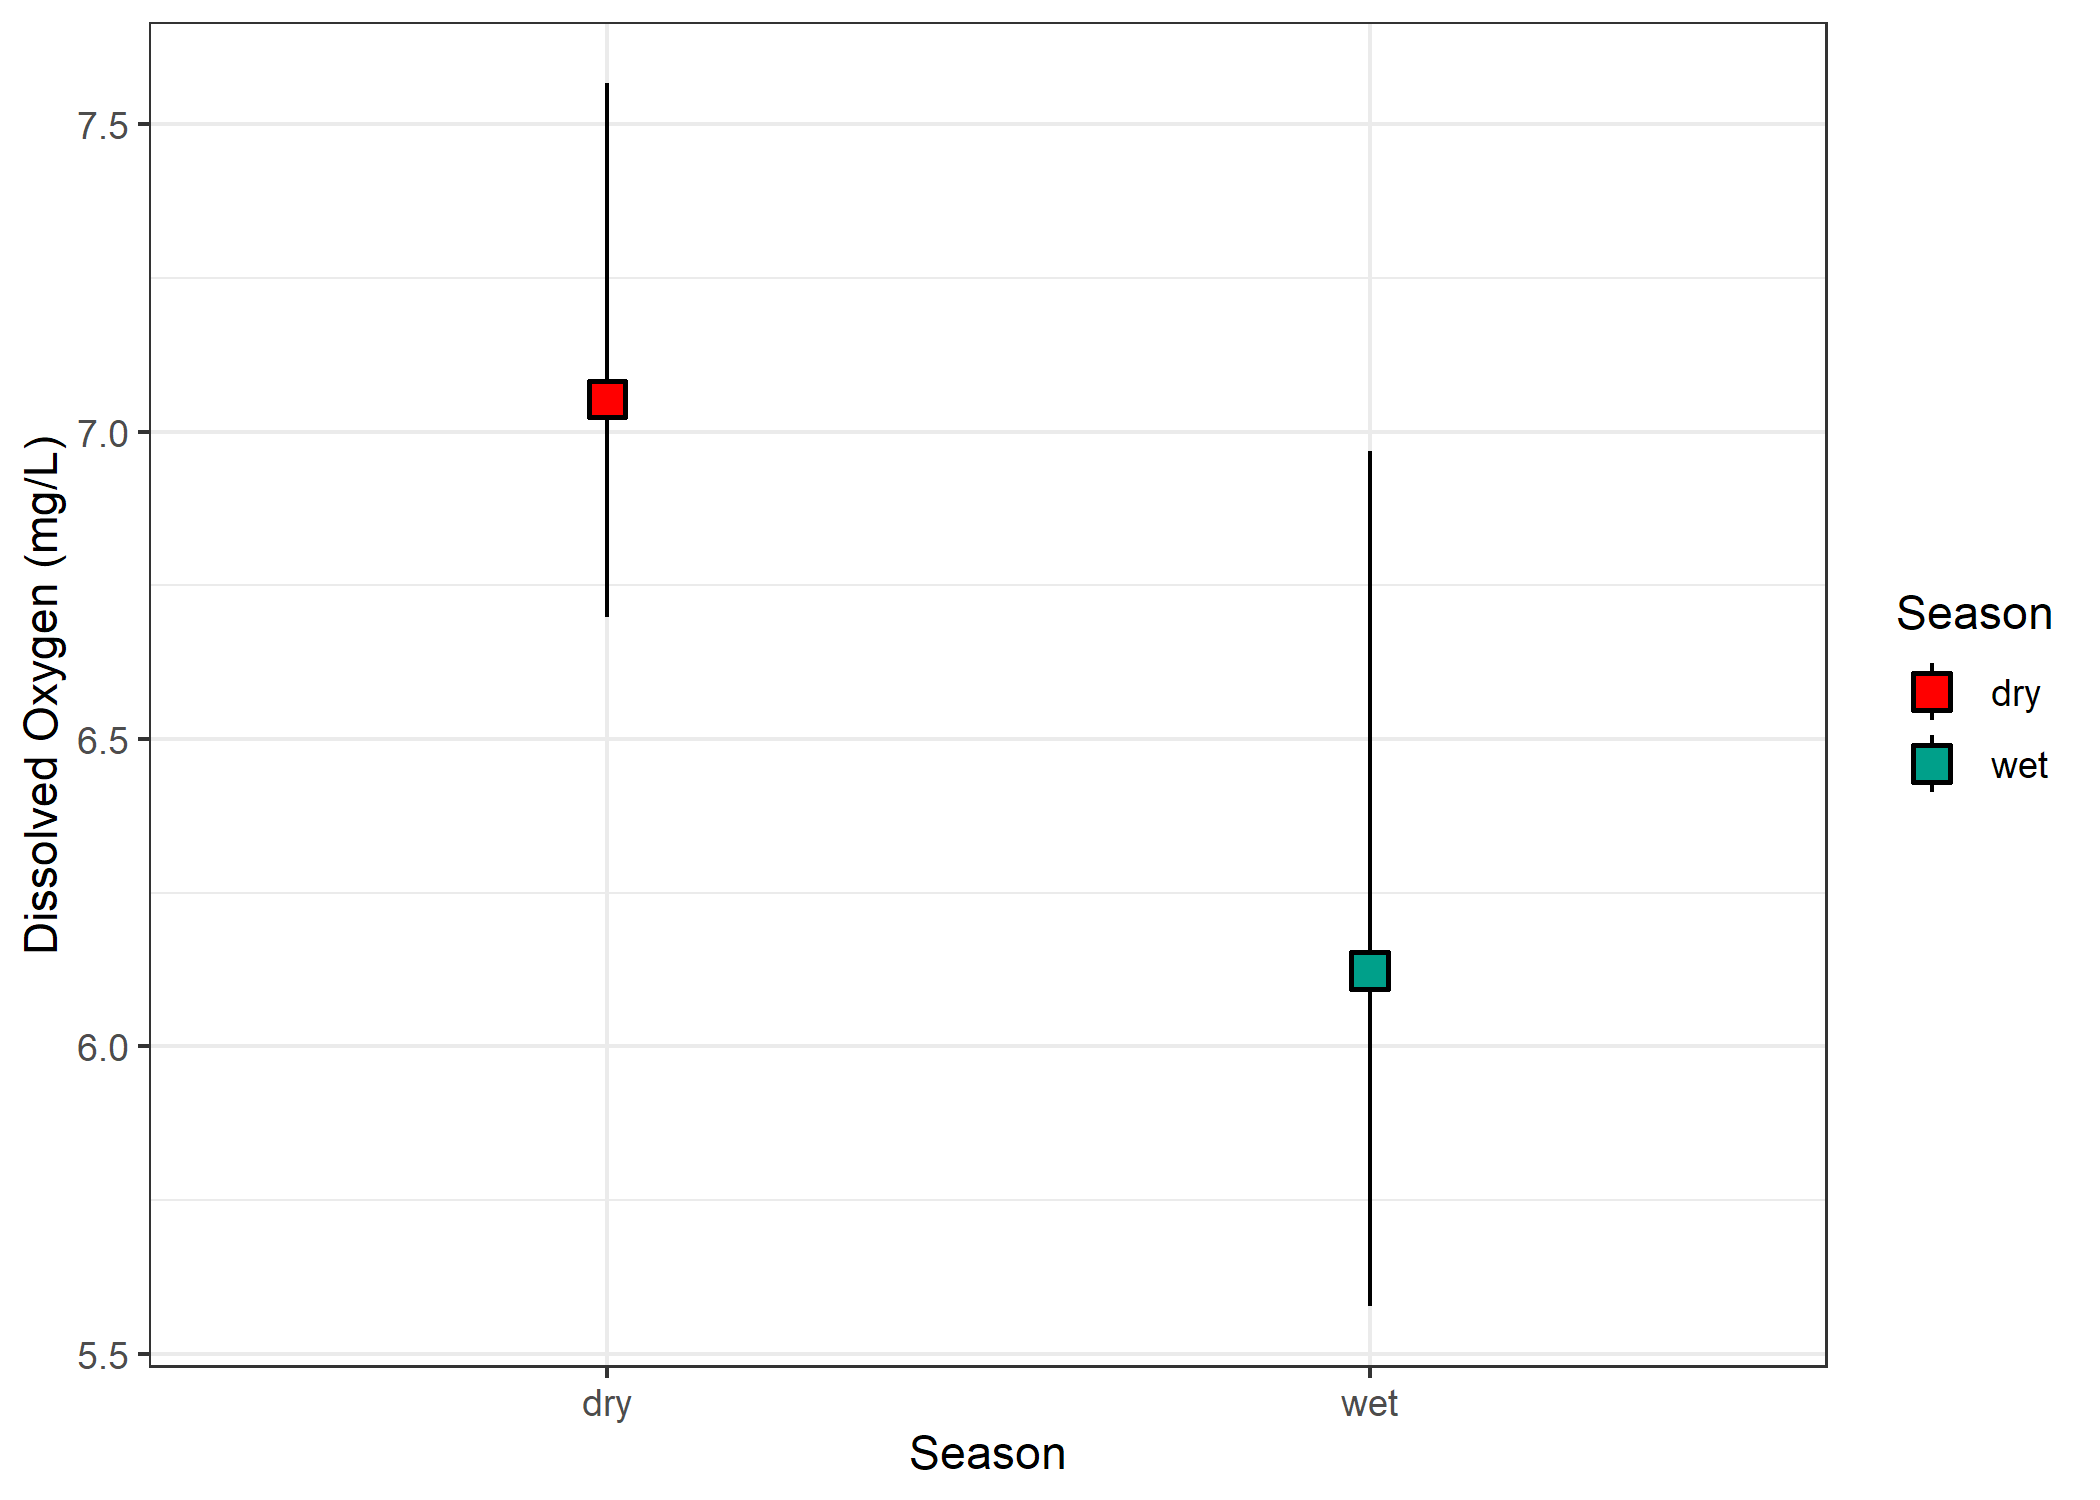 Table 1.
Seasonally averaged ranges
Table 1.
Seasonally averaged ranges
| season | DO_min | DO_max | DO_mean | DO_range | peak_shift | trough_shift | ratio |
|---|---|---|---|---|---|---|---|
| dry | 6.697787 | 7.566482 | 7.053075 | 0.8686952 | 0.5134069 | -0.3552883 | 1.445043 |
| wet | 5.578047 | 6.968147 | 6.123676 | 1.3901000 | 0.8444707 | -0.5456293 | 1.547700 |
Dry Season Range: 0.87 mg/L (26.54 umol O2/kg)
Wet season Range: 1.39 mg/L (42.48 umol O2/kg)
The absolute value of the peak shift relative to the average pH
How does all this compare to Pezner et al. 2023?
They observed a mean daily range of 81 umol O2/kg (2.65 mg/L), with a minimum range of 23 umol O2/kg (0.75 mg/L) and a maximum range of 258 umol O2/kg (8.43 mg/L).
So Cheeca is certainly within the range of common DO ranges on reefs, albeit on the lower side.
What does all this mean for FRESCA Experiments?
Not too much. The DO data is too messy for my liking. I’d prefer to do a similar analysis by grouping together multiple reef sites in Florida, spanning reefs with various proximities to seagrass beds, coral cover, residence times, etc before making a final recommendation. I’d have to go looking for continuous datasets rather than discrete samples clustered during the day.
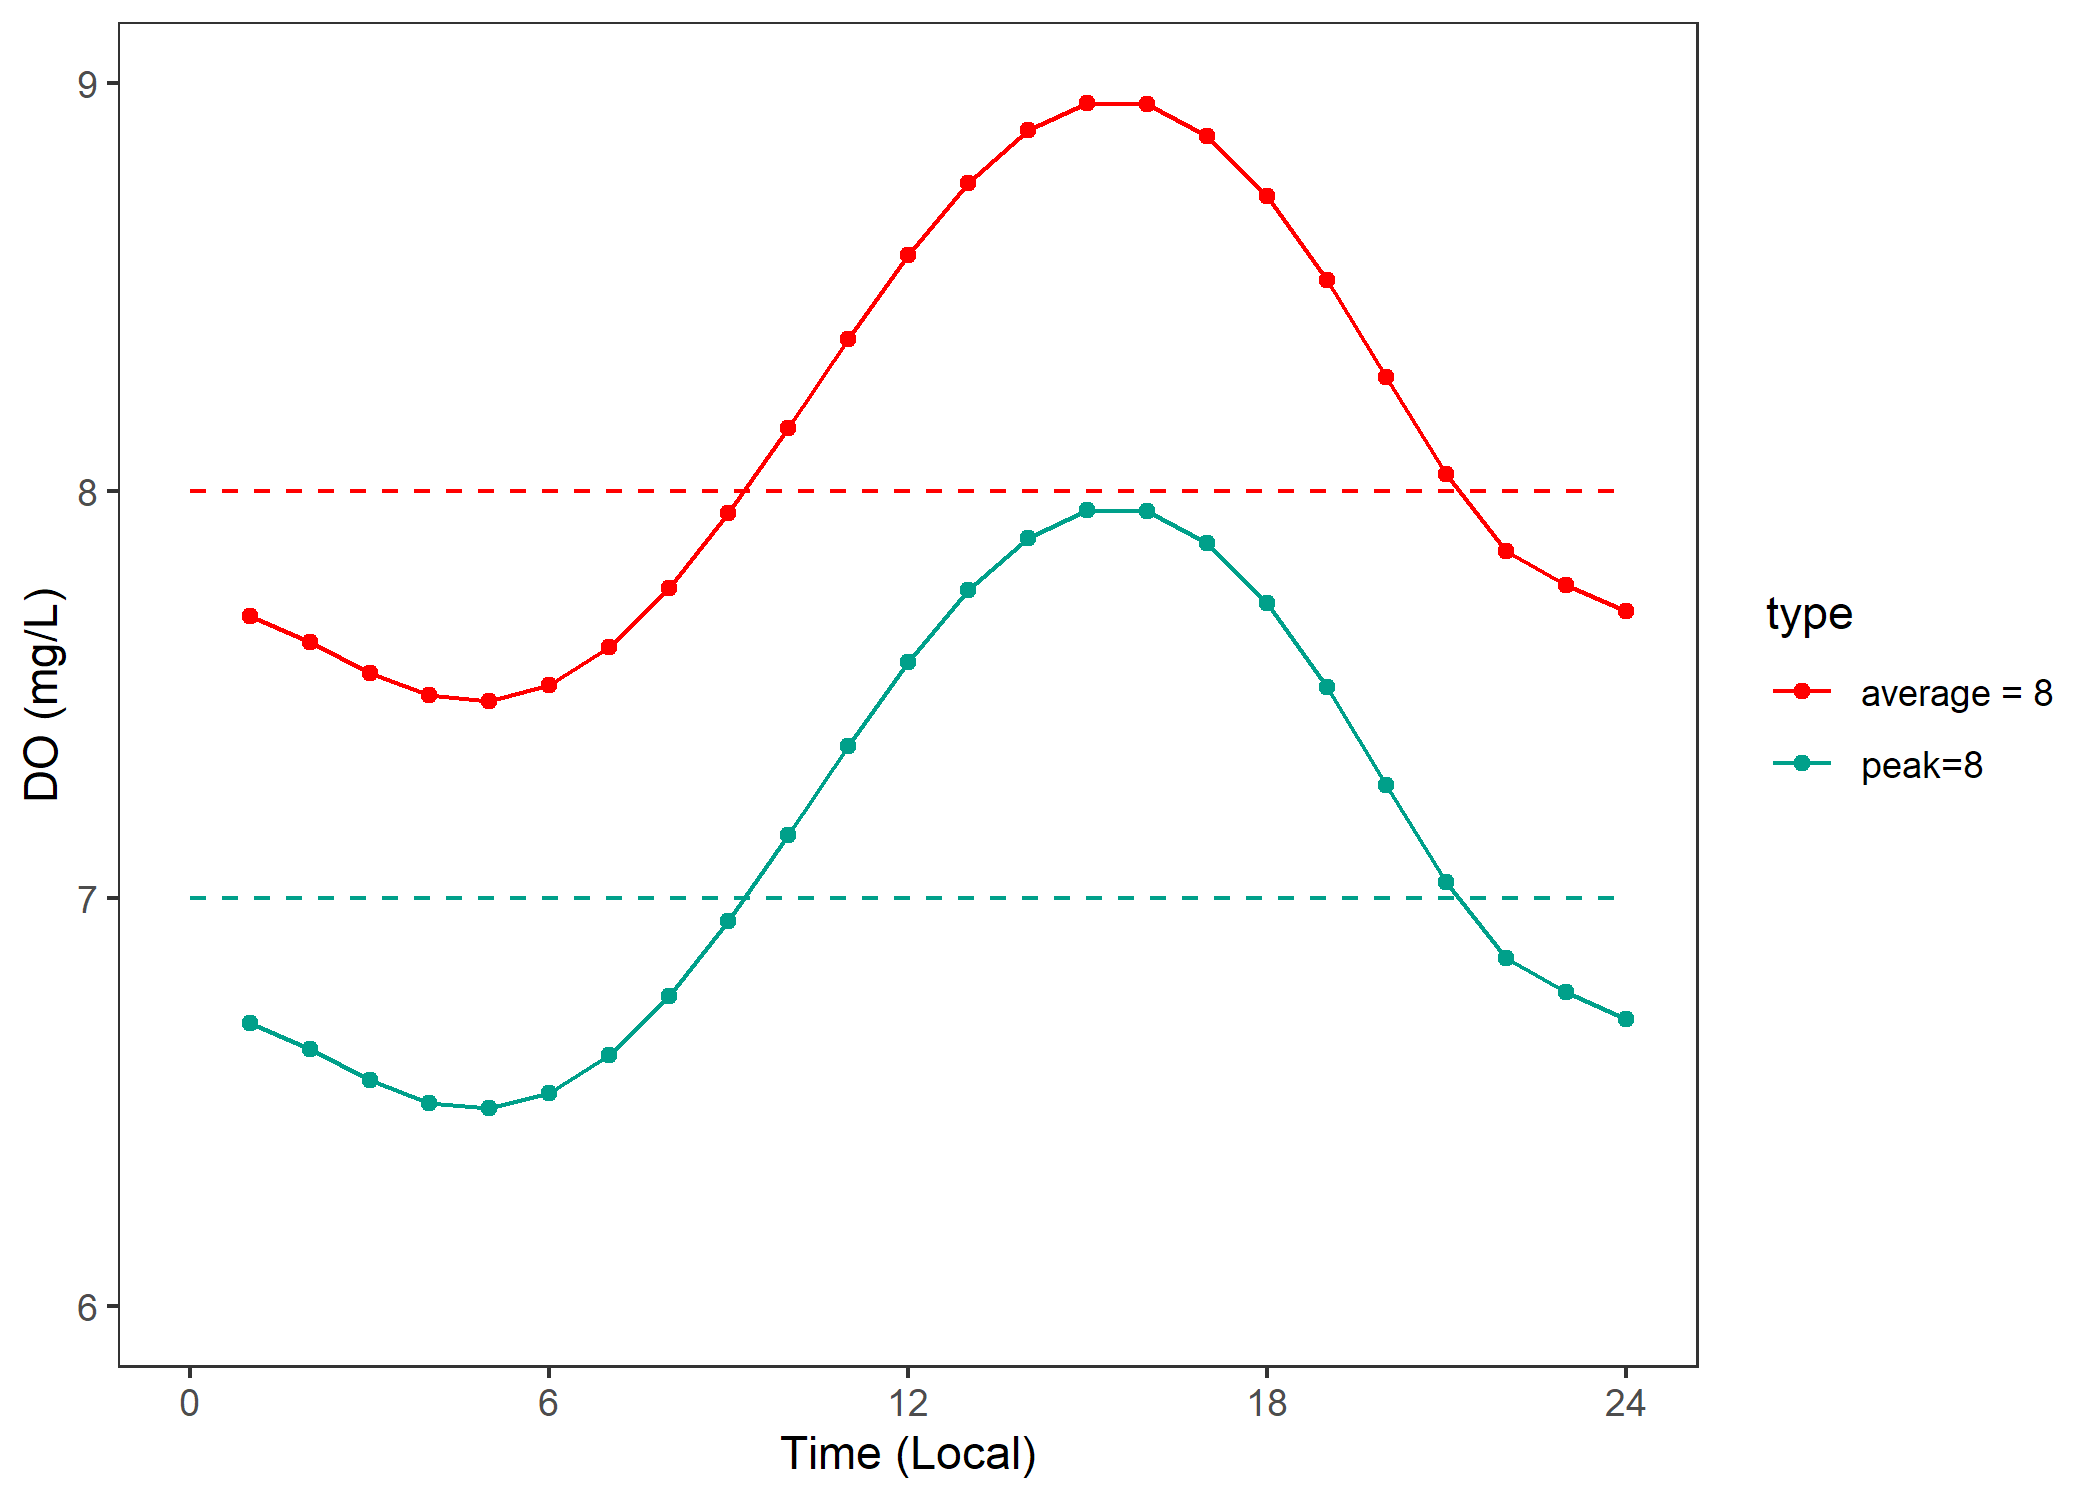
If I had to pick a number, 1.5 mg/L diel variability could work. It’s not far from the Wet season range seen at Cheeca and its within the range season on reefs aross the world from the data collected by Ariel Pezner. This could be implemented with a -0.5 mg/L at night and + 1 mg/L during the day. Some treatment possibilities are shown below with a fifth-order polynomial fit to the desired variability and defined troughs and peaks.
Table 2. 2 Posible Diel DO Implementations
| scenario | average | peak | trough |
|---|---|---|---|
| peak = 8 | 7 | 8 | 6.5 |
| average = 8 | 8 | 9 | 7.5 |
Figure 10. Experimental Diel Curve