Morphometrics from 3D Scans
research 04 Apr 2023I begin with theory and testing of my methods against published data. If you’d like to jump ahead to our data and my current thoughts, please click here.
Overview
Fractal dimensions (FD) describe space filling of shapes at various scales and describe surface complexity. While coral colonies and coral reefs are not strictly fractals, colonial organisms and reef assemblages share some key characteristics to fractals, including morphological irregularities, self-similarity and high degrees of space filling. FD can align with other traditional measurements such as surface area to volume ratio, rugosity, etc; but FD offers increased information as seen in the below theoretical example of a coral reef (Fig. 1; Torres-Pulliza et al 2020). This figure illustrates 3 reefs with identical rugosiites but decreasing fractal dimensions (FD), a < b < c.
Figure 1. Theoretical comparison of fractal dimension and rugosity
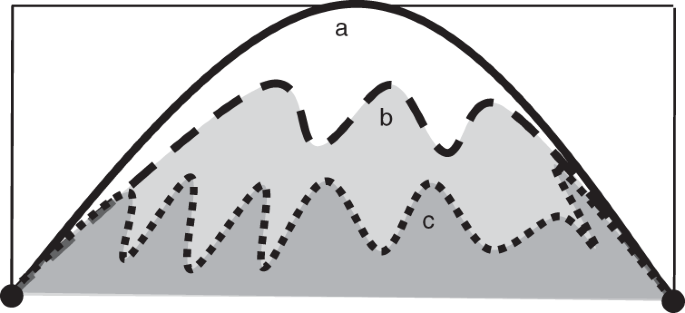 Many processes (ecological, growth, resistance to stressors, biophysical
pathways with seawater) may scale (linearly, non-linearly/unimodal) with
increased morphological complexity. Therefore, using FD to
quantitatively describe morphological complexity can be informative.
However, its important to note that FD is only a single metric of
morphological complexity and should be placed in appropriate context.
Since FD only describes space filling at different scales, dissimilar
shapes may share a FD despite rather obvious differences in branching or
size. Nevertheless, FD can play an important role in describing coral
morphology, especially when comparing ecosystems/coral colonies of
approximately the same scale.
Reichert et al (2017) developed an easy to use tool to calculate FD of a 3D coral colony using the Bouligand-Minkowski method. First, I am reanalyzing the 3D scanned files from Reichert et al (2017) to ensure I am using their code correctly. I am using their obj scan files and the analysis toolbox they released as part of the supplementary material. The toolbox takes in an obj scan file and produces a txt file with 3 columns: dilation radius, log(dilation radius), and log(influence volume). Dilation radius is produced for 1 <= R <= 20.
Figure 2. Example photographs and 3D scans in Reichert et al 2017

Reichert et al (2017) assessed the influence of dilation radii on the ability to discern inter-and-intraspecific differences among 3d scans (i.e. does a fractal D tell us if a coral fragment is identical to its clonemate/conspecific). They tested all integers 3 $\le$ R $\le$ 20, and found that when R = 8, fractal dimensions had the best ability to discriminate inter-and-intraspecific differences. Thus, they calculate and report all fractal dimensions based on a dilation radius of 8.
Given that the toolbox produces dilation radius from 1 $\le$ R $\le$ 20, you should be able to subset this data frame to just the integers 3 $\le$ R $\le$ 20 or all real numbers 3 $\le$ R $\le$ 20 to calculate and derive the same values reported in Reichert et al (2017). So I’m going to do just that.
Formulas
Reichert et al (2017) use the Bouligand–Minkowski method to estimate a colony’s fractal dimension as, “it is one of the most accurate methods for computing fractal dimensions and it is highly sensitive to detecting small changes in models (Tricot, 1995). Due to its use of Euclidean distances, the approach is invariant to rotation. Thus, prior normalization steps are not necessary (Tricot, 1995).”
They define D as, $D = 3 - \lim_{R \to 0} \frac{log(V(R))}{log(R)}$ where R is the dilation radius and V(R) is the influence volume.
Here, you can visualize the measuring principles of the Bouligand-Minkowski method with increasing dilation radii from a–>c. Spheres are located at the vertex of the 3d mesh. Larger radii progressively fill the volume enclosed by the mesh, resulting in a larger influence volume. The limit integrates across these spatial scales (radii a-c) to synthesize a singular characteristic of the mesh’s complexity.
Figure 3. Theoretical 3D Application of the Bouligand-Minkowski method with spheres

As this is a power law, you can estimate the limit by taking the slope of the log-log plot that fits the curve log(R) x log(V(R)). Thus, D can be estimated as 3-m, where m is the slope of the log-log plot.
You can progressively slide the curve from the beginning (R=2) to a maximum radii, and then calculate the slope over each defined region. For example, if you wanted to evaluate dilation radii from 2-15, you would first take the slope of the curve from (0,2), then (0,3), and so on until (0,15). You would calculate the FD at each R in the series and evaluate its discriminatory power.The code is as follows,
  #calculate linear model over the region
  m = lm(log.infl.vol ~ log.dil.rad,
          #filter data to integers only between 3 & 20
          #R is the desired dilation radius
          data = dat %>% filter(dil.rad<= & R))

  #extract the slope
  m$coefficients[[2]]
Example Data
Using the 3D scans from Reichert et al (2017), I independently calculated the Fractal Dimension using their toolbox. Below is a table of the data where I exclusively looked at time point 0 data.
| ID | Species | ReichD | D8 | diff |
|---|---|---|---|---|
| Plu_2\_01 | Plu | 1.92456 | 1.92456 | 0 |
| Pda_3\_02 | Pda | 1.93626 | 1.93626 | 0 |
| Pda_3\_03 | Pda | 1.95097 | 1.95097 | 0 |
| Pda_2\_03 | Pda | 1.96075 | 1.96075 | 0 |
| Pda_1\_05 | Pda | 1.94734 | 1.94734 | 0 |
As you can see, I am calculating their data the same way. So all calculations are working. Let’s proceed with discriminatory analyses.
Radii Analysis
I calculated a FD for radii 2-20 to conduct a discriminatory test similar to the Reichert et al (2017) analysis. They found that r=8 had the highest discriminatory power.
Interspecific Detection
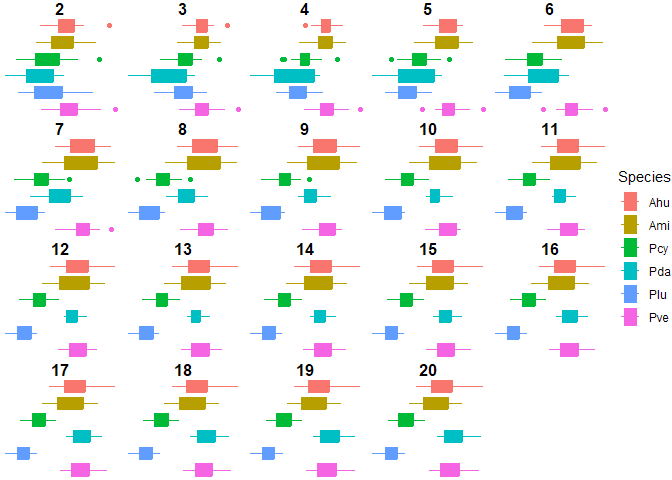
Figure 4. Interspecific discriminaotry power of FD at different radii
| radii | n |
|---|---|
| 7 | 12 |
| 8 | 12 |
| 19 | 11 |
| 20 | 11 |
| radii | p.avg | n |
|---|---|---|
| 8 | 0.0025290 | 12 |
| 7 | 0.0063254 | 12 |
| 20 | 0.0035425 | 11 |
| 19 | 0.0055155 | 11 |
Dilation radii of 7 and 8 produce the highest interspecific discriminatory power. Using these radii, we can differentiate between all species except: Ahu-Ami, Ahu-Pve, Ami-Pve, Ahu-Pda, Pda-Pve. When looking at the average pairwise significance from radii 7 and 8, 8 performs better than 7. 19 and 20 follow close behind, with these radii not being able to discriminate between Ahu and Pda, but their average pairwise significance is still better than a radii of 8. So we cannot differentiate the Acroporas and the Pocillopora verrucosa with radii of 7 and 8, and we add Pocillopora damicornis to that list when we change the radii to 19 or 20. Therefore, we are really only able to differentiate between the Porites and the branching corals.
Intraspecific Detection
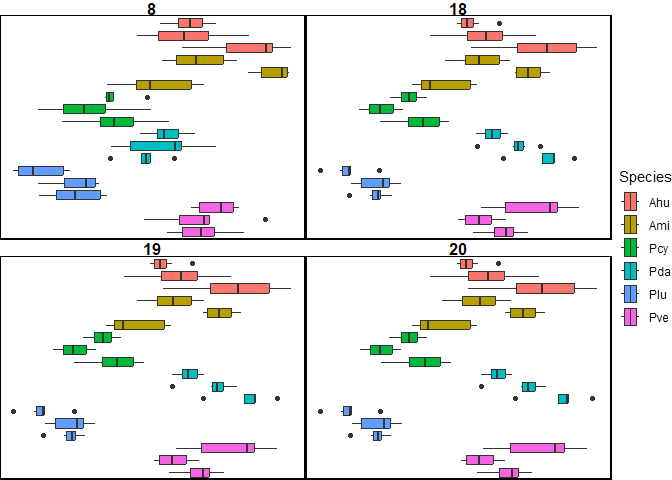
Running these tests on only a subset of radii where the n from Table 2 is greater than or equal to 10 (the 8 best performing radii).
Figure 5. Intraspecific discriminaotry power of FD at different radii
| radii | n |
|---|---|
| 19 | 11 |
| 20 | 11 |
| 18 | 9 |
| 9 | 6 |
| 8 | 5 |
| 7 | 4 |
| 6 | 3 |
| radii | p.avg | n |
|---|---|---|
| 20 | 0.0142110 | 11 |
| 19 | 0.0145423 | 11 |
| 18 | 0.0067559 | 9 |
| 9 | 0.0113366 | 6 |
| 8 | 0.0096806 | 5 |
| 7 | 0.0127828 | 4 |
| 6 | 0.0190583 | 3 |
For intraspecific differences, dilation radii 19 & 20 produced optimal results, followed closely behind by 18 (Table 3). This is different from interspecific variation; 7 and 8 performed much worse here (< half of detected pair-wise differences compared to 19,20). 18, 19 and 20 could detect intraspecific differences in all 6 species, while 7 and 8 could only detect intraspecific differences in 2 species (Acroporas). Differences in all 3 Ami colonies could be detected with a radii of 8, 9, 18, 19 or 20, suggesting consistently different morphologies for each of the colonies of this species. Ahu (6 radii), Pcy (2 r) and Pda (2 r) could detect 2 pairwise differences, indicating a single colony was significantly different than the other two.
These results are interesting. While fractal dimensions cannot distinguish between Acroporas and other branching species, it can consistently distinguish intraspecific variation among these species, especially Acropora humilis. This might suggest that these species have plastic morphologies that vary among the population, but that this variation can be parsed apart by colony-specific morphology. Further, Reichert et al (2017) report the fractal dimension analyses were superior in quantifying intraspecific changes of colonies over time compared to traditional morphological characteristics, indicating that these analyses are sensitive to small scale changes. Are these colonies collected from distinct environments, which uniquely shaped the colony morphology? Are genetics at play? From these data alone, it’s impossible to tell. But we can begin to explore these questions using my data below.
The take away from these analyses are:
- morphological complexity can be described with fractal dimensions,
- FD can generally discern between inter- and intra-specific, but its not perfect, and
- dilation radii must be selected according to resolution of analyses.
Analyzing Our Scans
Morphometrics
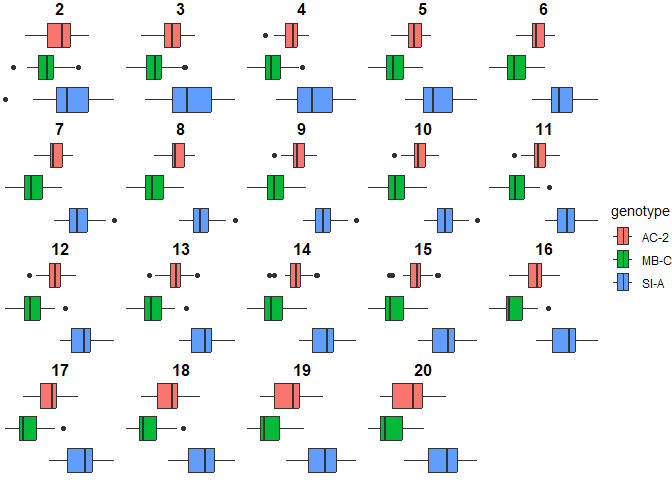
Figure 6. Genotype-specific discriminaotry power of FD at different radii
| radius | \*\*\*\* | \*\*\* | \*\* | - | ns |
|---|---|---|---|---|---|
| 6 | 3 | NA | NA | NA | NA |
| 7 | 3 | NA | NA | NA | NA |
| 8 | 3 | NA | NA | NA | NA |
| 9 | 3 | NA | NA | NA | NA |
| 10 | 3 | NA | NA | NA | NA |
| 11 | 3 | NA | NA | NA | NA |
| 12 | 3 | NA | NA | NA | NA |
| 13 | 3 | NA | NA | NA | NA |
| 14 | 3 | NA | NA | NA | NA |
| 15 | 3 | NA | NA | NA | NA |
| 16 | 3 | NA | NA | NA | NA |
| 17 | 3 | NA | NA | NA | NA |
| 5 | 2 | 1 | NA | NA | NA |
| 18 | 2 | 1 | NA | NA | NA |
| 19 | 2 | 1 | NA | NA | NA |
| 4 | 2 | NA | 1 | NA | NA |
| 20 | 2 | NA | 1 | NA | NA |
| 3 | 1 | NA | 1 | 1 | NA |
| 2 | NA | 1 | NA | NA | 2 |
| radii | p.avg |
|---|---|
| 11 | 2.00e-07 |
| 10 | 2.00e-07 |
| 12 | 2.00e-07 |
| 9 | 3.00e-07 |
| 13 | 3.00e-07 |
| 8 | 5.00e-07 |
| 14 | 6.00e-07 |
| 7 | 1.40e-06 |
| 15 | 1.40e-06 |
| 16 | 4.00e-06 |
| 6 | 7.10e-06 |
| 17 | 1.33e-05 |
Dilation radii 6-17 perform the best and have identical significance levels. If we take a look at the average pairwise significance between the 3 groups, using a radius of 11 produces the best results. However, choosing any radius 6-17 will produce a very significant average p value <0.00001, which adds confidence that there is a difference in the fractal dimensions of these 3 genotypes.
This is interesting because these fragments were picked to be,
- around the same size ~7cm,
- from unique colony in nursery (a tree had >60 colonies all of one genotype), and
- minimal branching w/ only 1 apical tip.
So even though we selected to have visually identical fragments, genotype specific morphology is evident. Let’s investigate other classical morphometrics to see if these genotypes were different. For all analyses below, I am using FD11 as the measurement of FD.
Figure 7. Traditional morphometric comparisons of fragment height, surface area, volume, and surface area: volume ratio
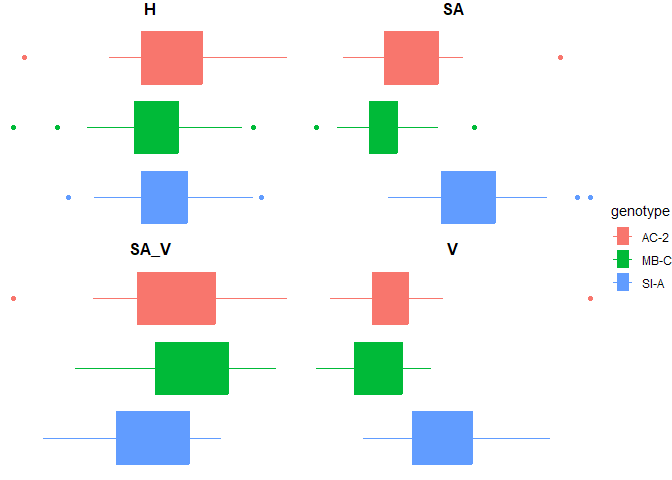
The three genotypes did not have significantly different surface area to volume ratio or heights. However, there were significant pairwise differences between surface area and volumes between SI-A and the other genotypes. Standardizing all growth rates to surface area is therefore critical for this data.
Figure 8. Linear regression of traditional morphometrics to FD
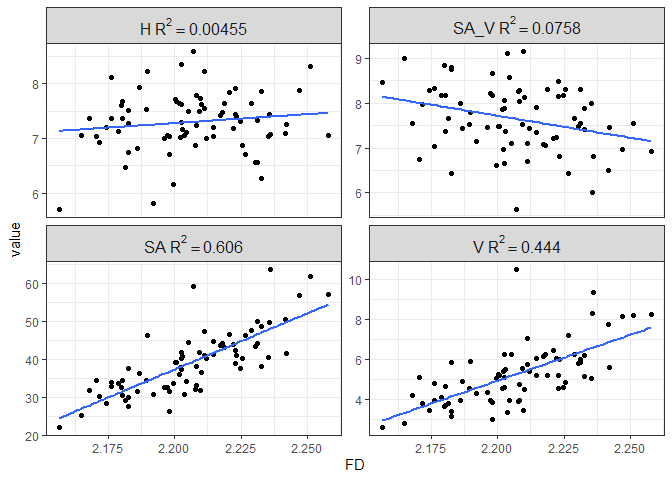
There’s a pretty strong relationship between surface area and volume with FD, with FD explaining about 61% and 44% of the variance in SA and V, respectively. There is no relationship between height and surface area to volume ratio with fractal dimension.
Growth Analysis
An in depth analysis of treatments and growth can be viewed here.
Figure 9. Avg Daily Growth by (A) Treatment and (B) Genotype
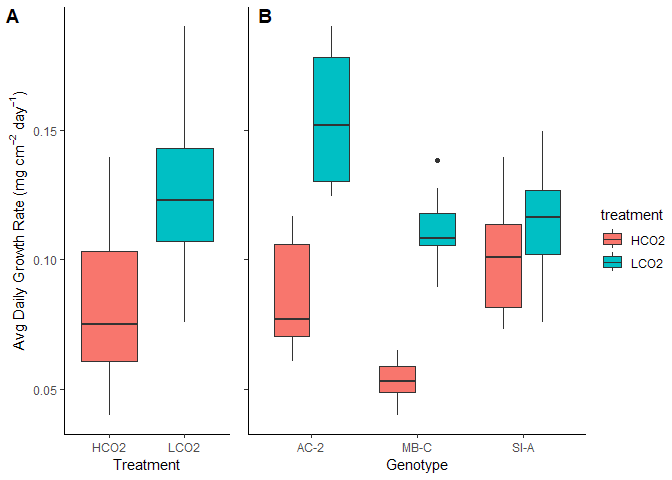
Growth rates are lower than anticipated. This is a combination of actually depressed growth from what I was expecting and the high resolution of our 3D scanner where estimated SA is much higher than usually measured. To try and make comparable, I looked at some other published work on the ’ol AcDC and found some SA derived from stitched together images on imajeJ in a Muller et al paper. Their average SA was about 7$cm^2$, which is in comparison to our avg SA 39 $cm^2$. If we simply divide the two and scale the growth rates accordingly, we get an avg LCO2 growth rate of 0.73 mg $cm^{-2}$ $day^{-1}$. However, numerous papers from the NOAA AOML Coral Program lab have used the same 3D scanner setup to derive growth rates that were higher than what I observed. I do not know the exact SA from these studies to scale accordingly, but these experiments were significantly shorter than the experiment I ran which may explain their elevated growth rates since a long time in the lab generally decreases growth rates compared to corals in the field (Enochs et al. 2018 for instance). Nevertheless, the patterns are interesting and what I will be focusing on.
Figure 10. Regression of absolute growth (mg) to (A) surface area and (B) fractal dimension, separated by treatment group
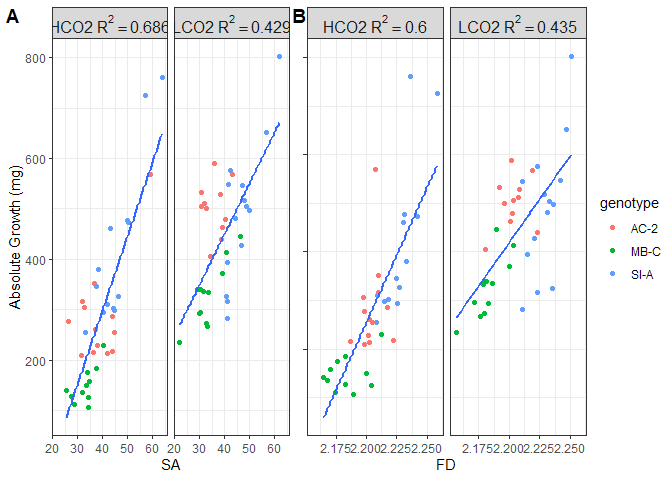
Figure 11. Regression of daily growth rate (mg/cm^2/day) to (A) surface area and (B) fractal dimension, separated by treatment group
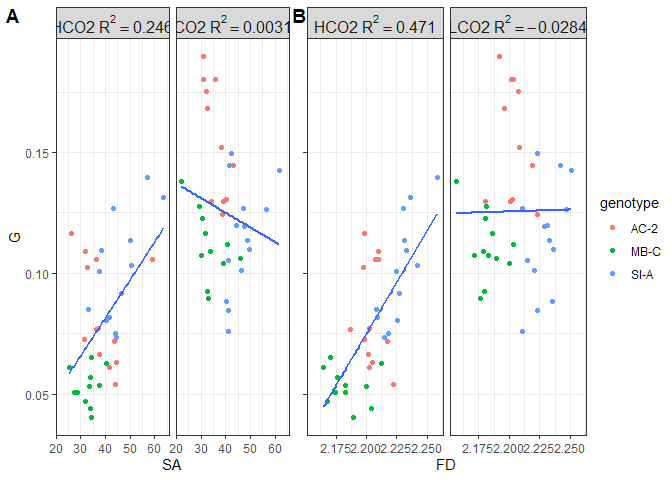
Absolute growth scales with both surface area and fractal dimension. Surface area and FD explain more variance in the HCO2 (69% v 60%) than the LCO2 (43% v 44%) groups. Overall, surface area explains more variance in absolute growth than FD, but it is roughly negligible.
When standardizing absolute growth to surface area, an interesting pattern emerges. Here, the amount of variance in growth rates explained by FD is nearly twice that of surface area. Further, for the LCO2 groups, none of the variance in growth rates is explained by either of the morphometrics, which is in contrast to the HCO2 groups where surface area and FD explain 25% and 47% of the variance, respectively. This brings the hypothesis that surface complexity “only matters” for OA resistance and not for increased growth rates under ambient conditions. I’ll explore more on this below.
We cannot separate SA and FD from each other completely. Since FD describes how surface area fills space at different scales, it makes sense that as FD increases, SA could increase as well. Not necessarily (see Fig 1 for instance, they all have the same SA if the lines were extended to a plane) and not in a linear relationship, since they are describing two different aspects of the geometry. Nevertheless, SA and FD are intertwined. This data, therefore, demonstrates that resistance to OA (maintained growth rates) is driven more by fractal dimensions (measurement of surface complexity) than by total surface area. Further, since SA standardized growth rates still increased as surface area increased, it is likely that growth rates do not scale linearly with SA.
What does this all mean?
Let’s dive into that second plot more and the hypotheses that this data
may support.
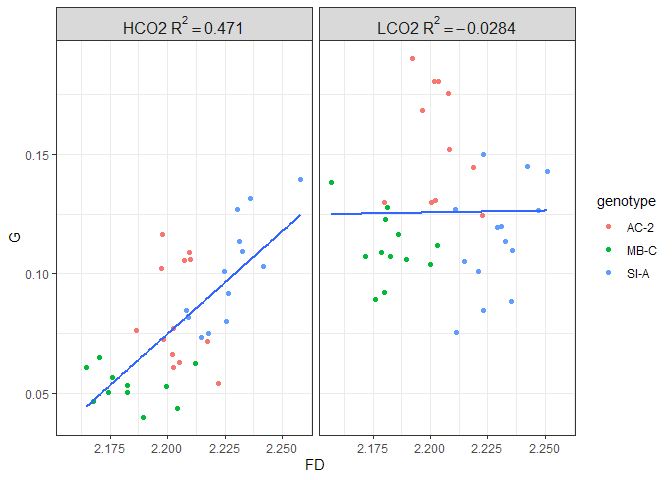
This data supports the hypothesis that surface complexity confers resistance to OA but does not confer increased growth rates under ambient conditions. Its far from a perfect relationship, but I think something is here. One immediate question I have is does the FD mean anything for the coral micro environment? The range of FD is 2.175-2.25, which although derived from log-log slope and limited between 0-3, seems quite narrow of a range to be divergently meaningful. See notes on next steps where I will try to test this using computational models.
This hypothesis aligns closely with the hypothesis outlined in Chan et al (2016). Briefly, surface complexity slows water flow around the colony, thickening the diffusive boundary layer (DBL) and increasing water residence time in the thin layer directly surrounding the coral. Therefore, the coral’s metabolism has a greater influence on the properties of this seawater: during the day this water will have a higher pH than bulk seawater (photosynthesis) and at night this water will have a lower pH than bulk seawater (respiration). Coral metabolism and water residence time is well investigated at the ecosystem scale where these same properties are at play, but how these properties play out at the organism scale remains largely unexplored. Together, these relative highs and lows create a variable pH environment that could stress harden a coral where it has adapted and/or acclimated and can, therefore, better withstand OA. Alternatively, this diel variability could work in concert with day to night calcification ratios to enhance daytime calcification to counteract the mean decrease in pH, effectively ameliorating OA (Enochs et al 2018; Chan & Eggins 2017).
Chan et al (2016) supported this hypothesis by measuring pH changes in the DBL under different morphologies at different flow rates. They saw that under low flow velocities and complex morphologies (they did not quantify complexity, just had 2 different species w/ obvious surface complexity differences), pH upregulation in the DBL was quite high and had the potential to ameliorate the effects of OA in the DBL (DBL pH under OA = DBL pH under ambient due to elevations). These data closely approximated their modeled pH increases based on photosynthesis and calcification rates. How these DBL pH increases manifest to growth rates/OA resistance remains to be seen. Comeau et al (2019) measured pH in DBL (micro probes), pH in calcifying fluids (boron systematics), and growth rates under different light and flow regimes. For the Acropora congeneric, they did not detect any elevations in DBL pH during the day, but did detect large decreases during the night. However, for Plesiastrea veripora, they detected a large increase in DBL pH which increased under OA treatments in low flow identical to the findings in Chan et al (2016). These same corals did not, however, have elevated pH in the calcifying fluid or maintain growth rates under OA. It is important to note that Comeau et al (2019) did not have variable pH treatments and did not systematically measure pH DBL under darkness.
Unfortunately, I was unable to measure the DBL pH with micro sensors, and I did not measure the metabolism of the corals. But, this is the first dataset I am aware of that has experimental evidence of surface complexity driving OA resistance. How the potential pH variability caused by the surface complexity affects calcifying fluid pH as determined by boron systematics remains to be seen. We should have that data soon. Comeau et al (2022) used boron systematics to probe the calcifying fluid pH of corals collected from volcanic CO2 seeps in Papua New Guinea. These seeps had low, but highly variable pH. The corals from this environment maintained constant calcifying pH, relative to nearby controls, despite the low mean pH. The growth rates of these corals are not known.
Next steps
I think there is an interesting story here of genotype-specific surface complexity correlating with OA resistance. First, I’d like to explore some more metrics of surface complexity from these 3D scans. I’m excited to finish up the boron chemistry work to see how that plays into this story. Finally, I’d like to import a characteristic 3D model of each genotype into a computational model to see if surface complexity measures due indeed create a thicker DBL. From this model, I can measure water residence times, expected pH increases, etc.
References
- Chan NCS, Wangpraseurt D, Kühl M, Connolly SR (2016) Flow and coral morphology control coral surface pH: Implications for the effects of ocean acidification. Frontiers in Marine Science 3:1-11.
- Chan WY, Eggins SM (2017) Calcification responses to diurnal variation in seawater carbonate chemistry by the coral Acropora formosa. Coral Reefs 36:763–772.
- Comeau S, Cornwall CE, Pupier CA, DeCarlo TM, Alessi C, Trehern R, McCulloch M (2019) Flow-driven micro-scale pH variability affects the physiology of corals and coralline algae under ocean acidification. Scientific Reports 9:1–12.
- Comeau S, Cornwall CE, Shlesinger T, Hoogenboom MO, Mana R, McCulloch MT, Rodolfo-Metalpa R (2022) pH variability at volcanic CO2 seeps regulates coral calcifying fluid chemistry. Global Change Biology 28(8):2751–2763.
- Enochs IC, Manzello DP, Jones P, Aguilar C, Cohen K, Valentino L, Schopmeyer S, Kolodzeij G, Jankulak M, Lirman D (2018) The influence of diel carbonate chemistry fluctuations on the calcification rate of Acropora cervicornis under present day and future acidification conditions. Journal of Experimental Marine Biology and Ecology 506:135–143.
- Reichert J, Backes AR, Schubert P, Wilke T (2017) The power of 3D fractal dimensions for comparative shape and structural complexity analyses of irregularly shaped organisms. Methods in Ecology and Evolution 8(12):1650–1658.
- Torres-Pulliza D, Dornelas MA, Pizarro O, Bewley M, Blowes SA, Boutros N, Brambilla V, Chase TJ, Frank G, Friedman A, et al (2020) A geometric basis for surface habitat complexity and biodiversity. Nature Ecology & Evolution 4:1495-1501.